This page shows how the four core platform components introduced in the Platform Overview (model-driven architecture, data integration, machine learning, and elastic compute) are used together in a working application. The example is a turbine monitoring system that predicts mechanical failures. It collects live sensor data, analyzes that data for early signs of equipment issues, and recommends preventive actions based on those predictions.Documentation Index
Fetch the complete documentation index at: https://devdocs-shaunak-branch.mintlify.app/llms.txt
Use this file to discover all available pages before exploring further.
Application model
Every C3 AI application starts by modeling the things it needs to reason about. In this example, we have physical assets, incoming data, machine learning components, and the outputs that drive maintenance operations. The diagram below shows the model used in this example.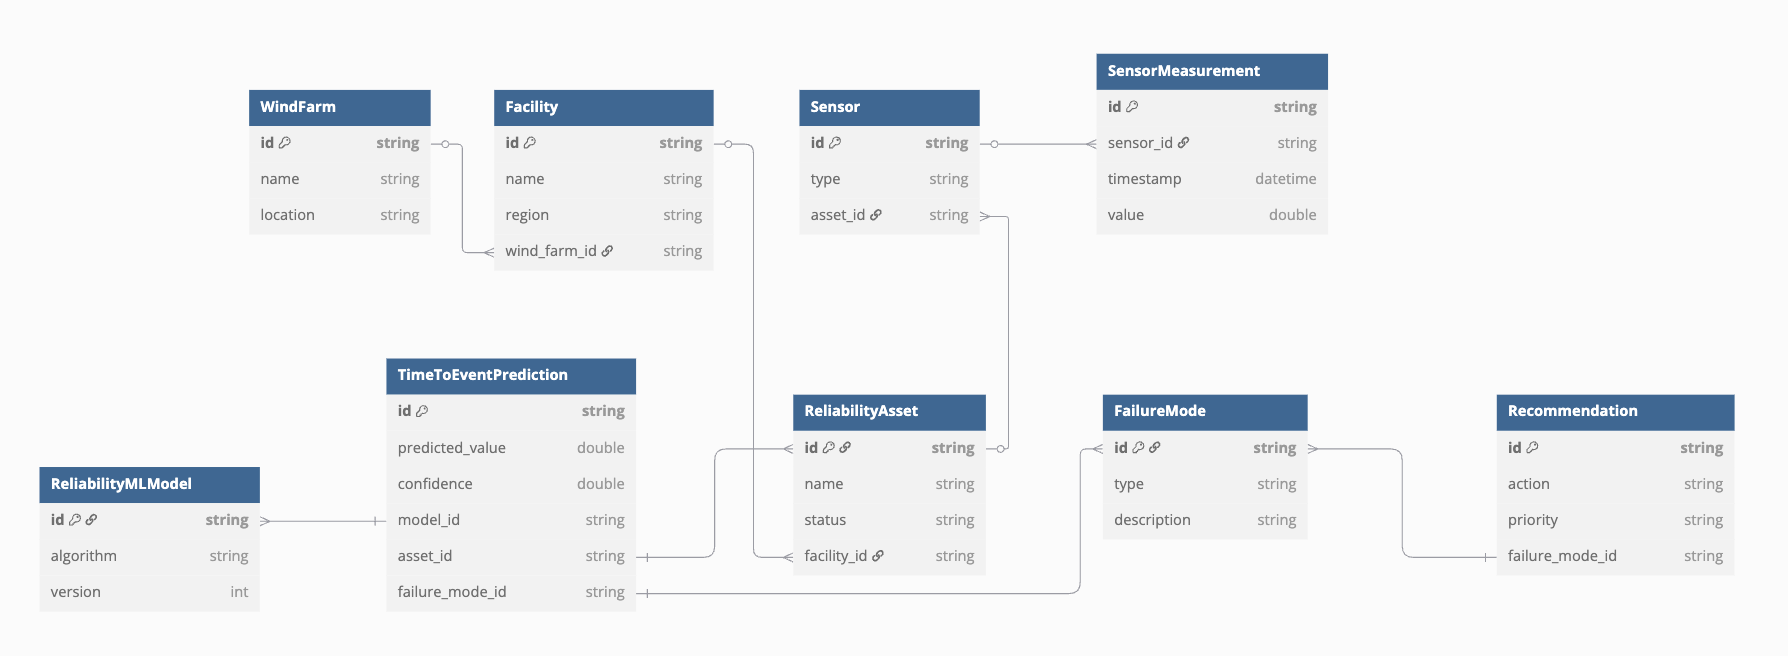 First are the types that describe the physical system being monitored, from facilities containing wind turbines to the individual sensors collecting data on those turbines.
- WindFarm: A named site or region containing multiple turbines.
- Facility: A physical subdivision within a wind farm.
- ReliabilityAsset: An individual wind turbine.
- Sensor: A device installed on an asset to collect data like vibration or temperature.
- SensorMeasurement: A time-stamped reading from a sensor.
- ReliabilityMLModel: A trained model used to generate predictions. Includes metadata like algorithm name and version.
- TimeToEventPrediction: A prediction result. Stores a failure time estimate and confidence score for a specific asset.
- FailureMode: A classification of the predicted failure type (example: a loose bearing).
- Recommendation: A suggested action (example: inspect) based on a failure mode.
Data integration
The system ingests telemetry from wind turbines and maps it into the application model. Data arrives from external systems—often in inconsistent formats—and needs to be cleaned and linked to the correct sensors and assets. In this example:- Turbines stream sensor data using a vendor API or MQTT broker.
- Incoming payloads are parsed and validated in a Connector Type.
- Each record is transformed using a Transformation Type that handles field renaming, unit conversion, or filtering.
- A Mapping Type matches the incoming sensor ID to a
Sensorobject and writes the reading as a newSensorMeasurement.
SensorMeasurement is immediately queryable, joined to its parent Sensor, and available for model scoring. These ingestion pipelines operate on the same Types defined in the application—there’s no need for external ETL tools or schema translation.
Machine learning
Once sensor data is flowing into the system, the application generates predictions about future equipment failures through theReliabilityMLModel. The platform supports this through three main components: feature store, model training, and scheduled scoring jobs.
C3 AI aids feature extraction and engineering by hosting a centralized Feature Store that acts as a repository for pre-computed feature data, providing functions for creating, materializing, and evaluating features.
Once features are selected, models are trained on labeled data, extracting outlier boundaries to aid prediction. Based on its performance, the model version can then be promoted and deployed to start generating predictions.
Once deployed, the platform schedules scoring jobs that use the current model and computed features to generate TimeToEventPrediction records for each monitored asset. Each prediction includes a failure time estimate, a confidence score, and references to both the source asset and the model version used.
Elastic compute
Applications run inside isolated environments that package the full application definition: Types, pipelines, models, schedules, and interfaces. Each environment:- Uses the same model definition
- Maintains its own data and configuration
- Runs jobs in its own compute pool
Next steps
This structure is reused across many applications. The same principles apply whether you’re monitoring turbines, forecasting supply chain demand, or analyzing manufacturing output. Explore prebuilt applicationsSee how C3 AI application suites solve real-world problems in asset performance, supply chain, and generative AI use cases. Learn how to build your own application
Start building with the C3 Type System and other core platform components.