Documentation Index
Fetch the complete documentation index at: https://devdocs-shaunak-branch.mintlify.app/llms.txt
Use this file to discover all available pages before exploring further.
Before you can operate Reliability effectively, you need to configure the system to match your real-world operations.
Configuration focuses on setting up out-of-the-box features. If your use case requires behavior beyond what is shown here, you can extend Reliability — we’ll provide some examples of that while explaining basic configuration tasks.
The diagram below shows all the core components you will configure. Together, they define the structure, behavior, and governance of your Reliability application.
How to read this diagram:
- You always start by defining your Reliability Asset Hierarchy — the core map of facilities, assets, and equipment.
- From there, you configure:
- Sensor Telemetry: Map historical and data streams to the asset hierarchy.
- Risk ML Model: Train and deploy models that predict asset degradation or failures.
- Facility and User Access Management: Control who can see and operate on different assets.
- Custom Metrics: (Optional) Create custom KPIs that complement ML-based risk scores.
- Outputs:
- Alerts: Define how model outputs trigger operational alerts.
- Case and Work Orders: Set up the processes operators use to investigate and resolve alerts.
- Reports: Aggregate and report on asset health, model performance, and alert trends.
The remainder of this page will provide a high-level overview of the key types that need to be configured to get started with Reliability.
However, the actualy steps to configure these components will be covered in the Configuration Guide. And for a quick tutorial with sample data, you can check out the Quickstart Guide.
This guide does not exhaustively document every type within the Reliability application.
For a full list of types and definitions, refer to the Reliability API Reference.Each section here focuses on actionable steps — helping you configure, extend, or maintain your application based on the core components you need to manage. Reliability asset hierarchy
The start of any Reliability deployment is defining the assets you are monitoring and maintaining. We then create digital twins to represent those real world assets.
Equipment of interest is called a Reliability asset. Reliability assets, the facility they belong to, and the sensors that collect data on their health vitals are what make up the asset hierarchy.
Throughout this page, we will follow a wind farm example, where our Reliability assets are wind turbines and their consitutent gearboxes and power converters.
Reliability assets are connected to:
- Sensors that measure performance and condition
- Facilities or other logical groupings that define where the asset belongs
- Hierarchies that describe the containment or aggregation structure (e.g., turbine belongs to a windfarm, gearbox belongs to a turbine)
Here’s what that might look like for a windfarm:
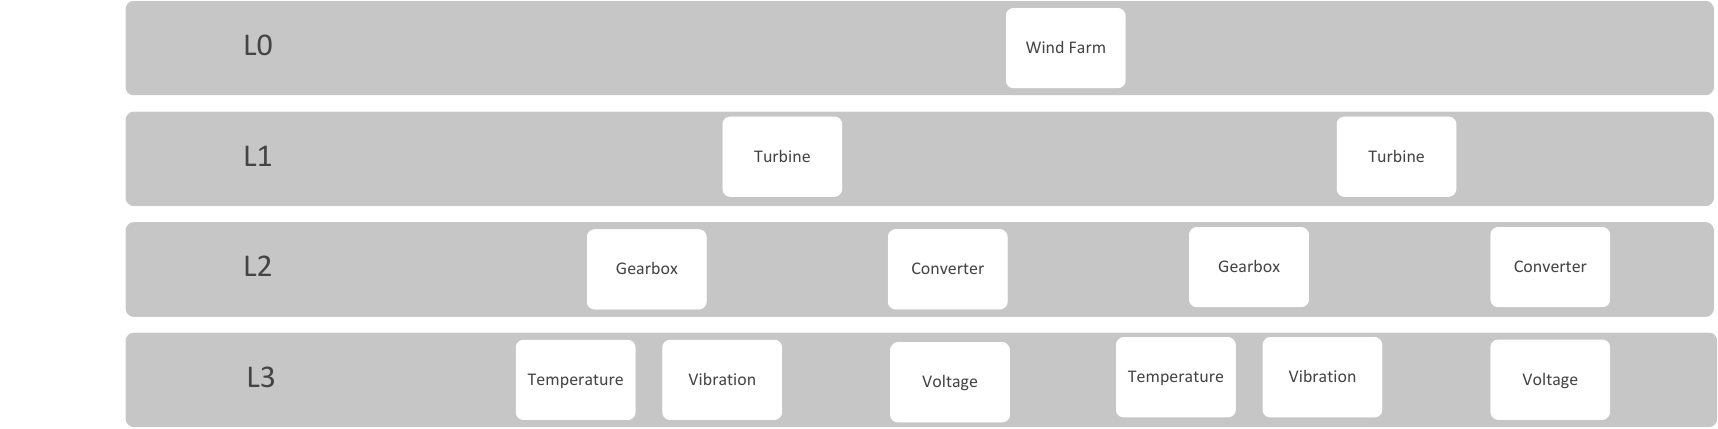 This diagram captures:
- L0: The windfarm as a whole — a facility in platform terms
- L1: Turbines grouped under that facility
- L2: Subsystems of each turbine (e.g., gearbox, electrical system)
- L3: Individual sensors that measure performance (e.g., vibration, temperature, voltage)
To represent this structure in the platform, you configure the following key types:
| Type | Purpose |
|---|
Facility | Represents the physical windfarm or collection of sites. |
ReliabilityAsset | Represents each maintainable system or component — turbines, gearboxes, converters, etc. |
Sensor | Represents measurement points (e.g., wind speed, rotor speed, vibration). |
Configuration example
- Define a
Facility object for the windfarm.
- Create one
ReliabilityAsset per turbine.
- Create child
ReliabilityAssets for key subsystems: gearboxes and power converters.
- Map
Sensor objects to their respective subsystems.
Extension example
If the customer wants to structure turbines based on their grid region and maintenance contractor (not just their physical location), you might extend the data model with:
- Custom metadata on
ReliabilityAsset for maintenance zone tagging
- A secondary, virtual hierarchy that reflects maintenance scheduling rather than physical location
- Custom dashboards or workflows that aggregate across these logical zones
Once the asset hierarchy is defined, you can start connecting historical and streaming data to the assets. This is where sensor telemetry comes in.
Sensor telemetry
Sensor telemetry configuration connects external data sources to your asset hierarchy.
This step, often called data ingestion, maps real-world sensor streams to ReliabilityAssets like gearboxes and converters, so the application can monitor asset health and drive predictions.
This structures who (asset), what (sensor), and when (measurement) so that Reliability’s models, alerts, and reporting work accurately.
These are the key types affected by this process:
| Type | Purpose |
|---|
Sensor | Defines the identity of a signal stream and ties it to a specific ReliabilityAsset (e.g., gearbox bearing temperature sensor). |
PointPhysicalMeasurementSeries | Groups time-series measurements for a sensor, structuring the raw telemetry over time. |
PointPhysicalMeasurement | Represents individual timestamped readings (e.g., 72°C at 10:00 AM) tied to a Sensor. |
Configuration example
You connect to a turbine SCADA system and fetch the Gearbox Oil Temperature every 5 minutes:
- Create a
Sensor object for Gearbox_Oil_Temperature attached to the gearbox asset.
- Pull live data from the SCADA API and transform it into canonical format.
- Write each temperature reading as a
PointPhysicalMeasurement.
- Group readings under the associated
PointPhysicalMeasurementSeries for structured access.
Extension opportunities
- Derived Sensors: Create calculated sensor streams like “Gearbox Temperature Rise Rate” (slope of temperature vs. time).
- Custom Ingestion Pipelines: Build specialized APIs or workflows to fetch and preprocess telemetry from new SCADA vendors or emerging sensor technologies.
- Synthetic Measurement Generation: Simulate missing data or derive new measurements from physical models (e.g., synthetic torque estimation from electrical parameters).
Risk model setup
Risk model setup defines how Reliability uses machine learning to predict asset risk and detect early signs of failure.
It transforms raw telemetry into actionable risk scores that drive alerts, cases, and maintenance actions.
Model setup follows this basic workflow:
To configure this flow in the platform, you will use a combination of:
| Type | Purpose |
|---|
DataValidationRun | Validates incoming telemetry for missing data, flatlines, invalid ranges, or gaps that would affect model quality. |
ReliabilityMlDatasetPreparationRun | Prepares datasets based on validated telemetry and asset filters for training ML models. |
ReliabilityMl.Project | Defines the risk modeling project: assets, output types, and feature scope. |
MlProject | The platform-level ML project tied to the Reliability-specific modeling. |
MlPipeline | Configures which sensor features are selected and how they are processed for model training. |
ReliabilityMlModel / MlModel | Trained machine learning models tied to a pipeline, deployed to assets for inference. |
MlModel.Router and MlModel.Route | Define how models are assigned dynamically to subsets of assets based on asset filters. |
Configuration and extension flow
Risk model setup requires a combination of configuration and extension, since there are many out-of-the-box features that can be used to build a custom risk model.
For instance, you can use an out-of-the-box risk model for gearbox failure, like a variational autoencoder, and then extend it by adding custom features or changing the model routing logic.
Or you can bring your own ML model and connect it directly to the MlPipeline.
In any case, you will need to define the following steps:
| Step | Entity | Action |
|---|
| 1 | DataValidationRun | Validate gearbox and turbine telemetry across windfarm. |
| 2 | ReliabilityMlDatasetPreparationRun | Prepare dataset with validated features for turbines. |
| 3 | ReliabilityMl.Project | Create a project for gearbox risk modeling. |
| 4 | MlProject | Set subject type = ReliabilityAsset, target output = risk score. |
| 5 | MlPipeline | Engineer and normalize selected telemetry features. |
| 6 | ReliabilityMlModel | Train and evaluate risk prediction model. |
| 7 | MlModel.Router / MlModel.Route | Route models to specific turbines by vendor, region, or class. |
Facility and user access management
Facility and user access management defines which assets and outputs users can see and manage within C3 AI Reliability.
It controls the logical partitioning of the system, ensuring that teams only access the facilities, turbines, and alerts relevant to their operations.
Without proper scoping, users would see irrelevant data or accidentally modify assets outside their area of responsibility — introducing confusion and risk.
This is a simplified view of a complex system that ties together assets, users, and access control — but it’s sufficient to understand how Reliability configuration works.
| Type | Purpose |
|---|
Facility | Represents a physical or logical location (e.g., wind farm, plant, line). Supports parent-child relationships for multi-level scoping. |
FacilityReliabilityAssetHierarchicalRelation | Connects facilities to the assets they own. Allows grouping assets under the correct physical site. |
FacilityAccessManager | Defines the administrative and operational user groups per facility (e.g., Admins, Operators, Engineers). |
User | Represents individual users who log in and interact with Reliability. |
Role | Defines permission levels (e.g., read-only, full admin, maintenance planner) and can be assigned at the facility level. |
Example: scoping access across sites
Suppose your wind portfolio spans multiple regions:
- “North Texas Wind Farm”
- “South Dakota Wind Farm”
- “California Coastal Wind Farm”
Configuration steps
-
Create
Facility objects:
- North Texas Wind Farm
- South Dakota Wind Farm
- California Coastal Wind Farm
-
Map
ReliabilityAssets to Facilities using FacilityReliabilityAssetHierarchicalRelation:
- Assign each turbine, converter, and gearbox to the correct wind farm facility.
-
Set up
FacilityAccessManager:
- For North Texas:
- Admin Group: “NTX Admins”
- Operational Group: “NTX Operators”
- Repeat for other wind farms.
-
Add
Users to the correct facility groups:
- Alice (Technician) → NTX Operators
- Bob (Fleet Manager) → Admin group for all facilities
-
Assign
Roles:
- Operators: Read/write access to assigned facility assets and cases.
- Admins: Full access, including model training and alert configuration.
This ensures that:
- Alice can only view and manage turbines in North Texas.
- Bob can see all sites and manage broader operational workflows.
Custom metrics setup
Reliability metrics allow you to define custom KPIs that represent important health conditions or operational performance indicators for your assets.
Metrics are flexible:
- They can be simple thresholds (e.g., vibration RMS > 0.5)
- Or complex expressions involving multiple sensors, aggregates, and conditional logic
- They can trigger alerts, populate dashboards, contribute to ML features, or power reports
You control what metrics matter for your fleet, using a simple formula language mapped directly onto sensor telemetry.
| Type | Purpose |
|---|
ReliabilityMetricSpec | Defines the configuration for a custom metric: name, formula, associated assets or facilities, permissions. |
ReliabilityMetric | Evaluated instances of the metric for a given asset or facility, providing live or historical values. |
ReliabilityMetricEvaluator | Helper that fetches sensor streams and computes metric values based on the configured formula. |
Sensor | Raw telemetry sources (e.g., vibration, temperature) used inside metric formulas. |
Example: defining a gearbox health metric
-
Define a
ReliabilityMetricSpec:
- Name:
"High Gearbox Vibration"
- Expression:
gearbox_vibration_rms > 0.4 && nacelle_wind_speed > 6
- Description: Flags high gearbox vibration under high load (excluding periods when turbines are idle).
-
Validate Expression:
- Use the platform’s validation tools to ensure the formula parses correctly and maps to valid sensor names.
-
Associate Metric with Assets:
- Attach the
"High Gearbox Vibration" metric to all wind turbines across the fleet.
-
Evaluate Metric:
- See live evaluations in dashboards.
- Trigger alerts if the metric condition holds for a configurable duration.
- Feed the metric output into risk models or historical performance reports.
Configuration flow
| Step | Entity | Action |
|---|
| 1 | ReliabilityMetricSpec | Define metric name, formula, target assets, and permission level. |
| 2 | ReliabilityMetric | Enable real-time or batched evaluation of metric values. |
| 3 | ReliabilityMetricEvaluator | (System-handled) Pull sensor data and apply formula computations. |
| 4 | Sensor | Ensure sensor names and units are normalized for consistent metric behavior across assets. |
Outputs
Outputs represent how Reliability translates model predictions into actionable operational work.
After scoring risk or detecting anomalies, the platform produces alerts, cases, work orders, and reports — connecting machine learning insights to real-world asset management.
Outputs are how risk predictions drive maintenance, monitoring, and continuous improvement.
We break outputs into three operational layers:
- Alerts (detect and route risks)
- Cases and Work Orders (manage resolution)
- Reports (summarize system health and risk trends)
Alerts
Alerts are the first point of action triggered by models or sensor telemetry.
Alerts identify emerging risks and link them to failure modes, sensor anomalies, or maintenance recommendations.
Note: The flow shown below is a simplified version of the full internal logic.
| Type | Purpose |
|---|
ReliabilityAssetAlert | Main object representing alerts triggered on assets (risk scores, anomalies). |
ReliabilitySensorAlert | Specialized alerts triggered from individual sensor issues (flatlines, outliers). |
ReliabilityAssetAlertFeedback | Captures operator feedback on alerts (e.g., true positive, false positive). |
FailureMode | Defines known failure patterns (gearbox bearing failure, blade icing) to contextualize alerts. |
FailureModeFeedback | Captures feedback on failure mode accuracy and relevance to improve predictions. |
Example: gearbox vibration risk alerts
- Threshold Configuration:
- Risk score > 80 → trigger gearbox risk alert.
- RMS vibration sensor flatline → trigger sensor health alert.
- Failure Mode Linkage:
- Gearbox vibration alert mapped to “Gearbox Bearing Degradation” failure mode.
- Operator Feedback:
- If an alert is a false positive, operators submit feedback that improves future model tuning.
Cases and work orders
Cases group related alerts into actionable incidents.
Work orders formalize the maintenance response to those incidents.
| Type | Purpose |
|---|
ReliabilityAssetCase | Groups one or more alerts into a manageable operational case. |
ReliabilityAssetAlertToCaseRelation | Maps specific alerts to the cases they belong to. |
WorkOrder | Represents the downstream maintenance action issued to technicians. |
Example: turbine gearbox case management
- Case Creation:
- Alerts for “Turbine 17 Gearbox Vibration Risk” and “Turbine 17 Oil Temp Rising” automatically grouped into a ReliabilityAssetCase.
- Work Order Generation:
- Create a WorkOrder to inspect gearbox lubrication and vibration sensor calibration.
- Feedback Loop:
- Technicians close work orders, providing maintenance outcomes that feed back into asset health monitoring.
Reports
Reports summarize system state, model health, and asset risk over time.
They are critical for high-level visibility and regulatory or operational reporting.
| Type | Purpose |
|---|
ReliabilityAssetReport | High-level report aggregating asset health and alert data across facilities. |
ReliabilityAssetReportSpec | Configuration object defining time ranges, asset scope, and formatting for reports. |
ReliabilityRiskMlModelReport | Model-focused report evaluating risk score trends and model stability over time. |
ReliabilityRiskMlModelReportSpec | Defines parameters for how model performance reports are generated. |
Example: fleetwide risk monitoring report
- Asset Risk Report:
- Weekly report showing gearbox risk score trends for all turbines.
- Highlights turbines with rising risk scores over 2 weeks.
- Model Performance Report:
- Evaluate if the gearbox risk model continues to perform with high confidence across seasons.
Once outputs are configured and operational, the next critical step is managing who can access Reliability, which assets they can see, and what permissions they have.
This ensures that alerts, cases, and reports are properly scoped to facility-specific teams and that operational workflows remain secure and organized.
Where to go next
Now that you understand what must be configured and why, the next steps depend on your goals: