The Analysis Page allows you to create interactive charts to dive into the application data. Tabs on the Analysis Page include:Documentation Index
Fetch the complete documentation index at: https://devdocs-shaunak-branch.mintlify.app/llms.txt
Use this file to discover all available pages before exploring further.
- Timeseries
- Scatter Plot
- Metrics (Beta)
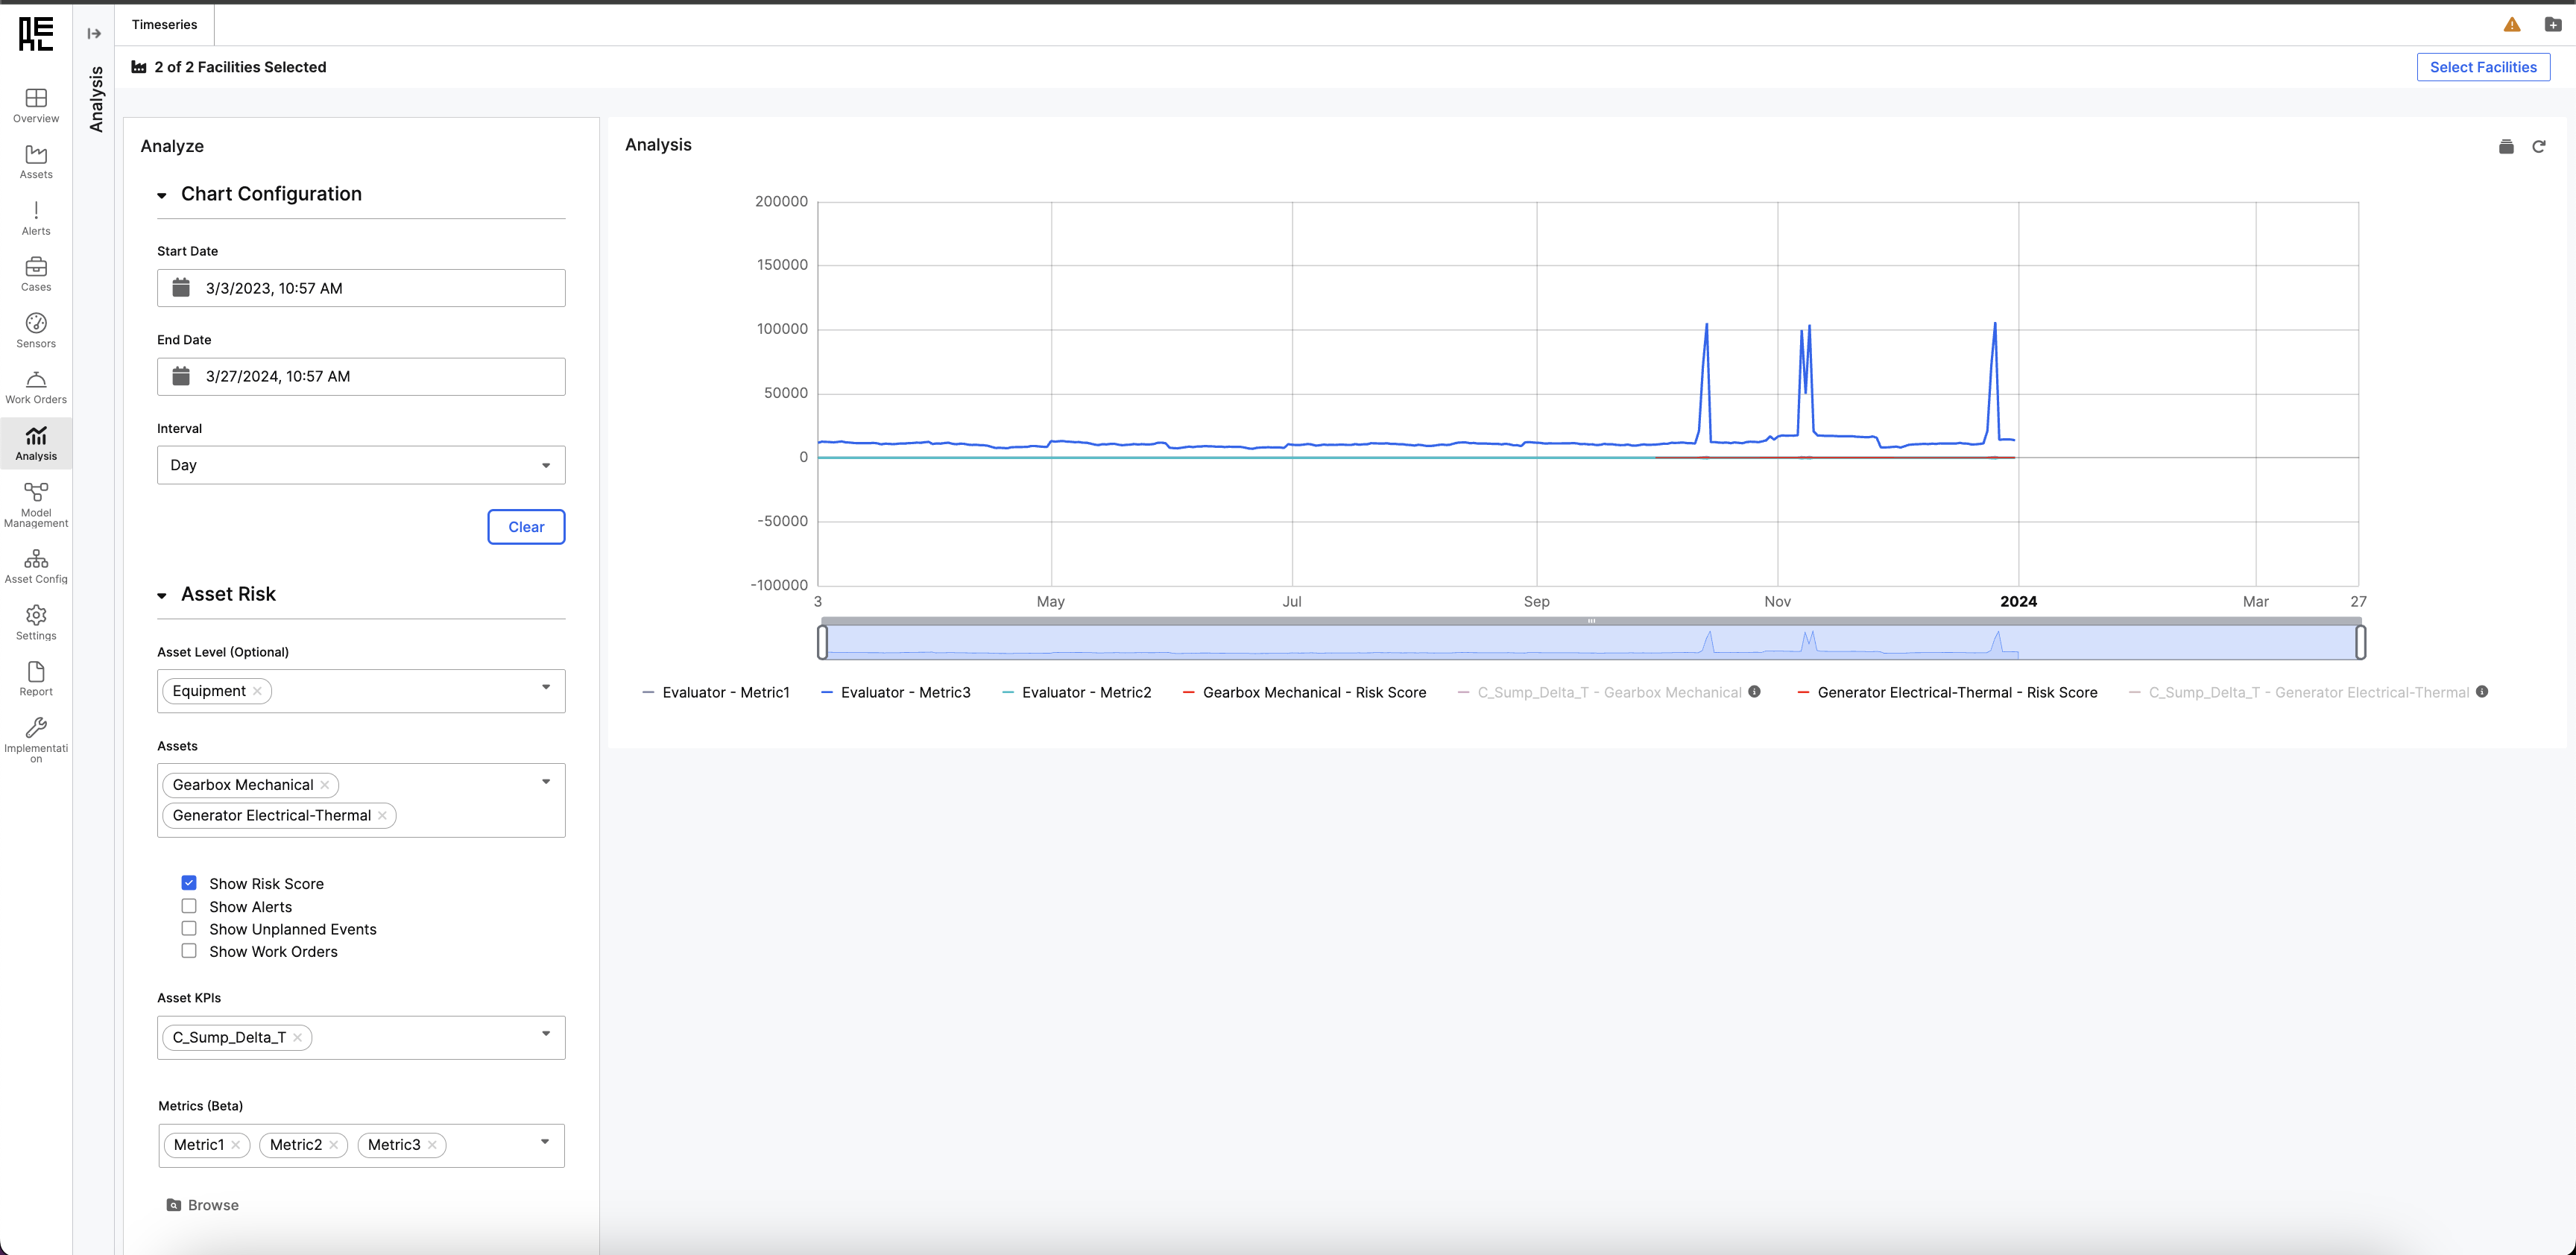
Timeseries Charts
You can plot any metric or time series data within the scope of the application instance (such as across a single Facility). For example, you may be interested in plotting time series measurements (Features) from two different aasets that relate to similar process steps.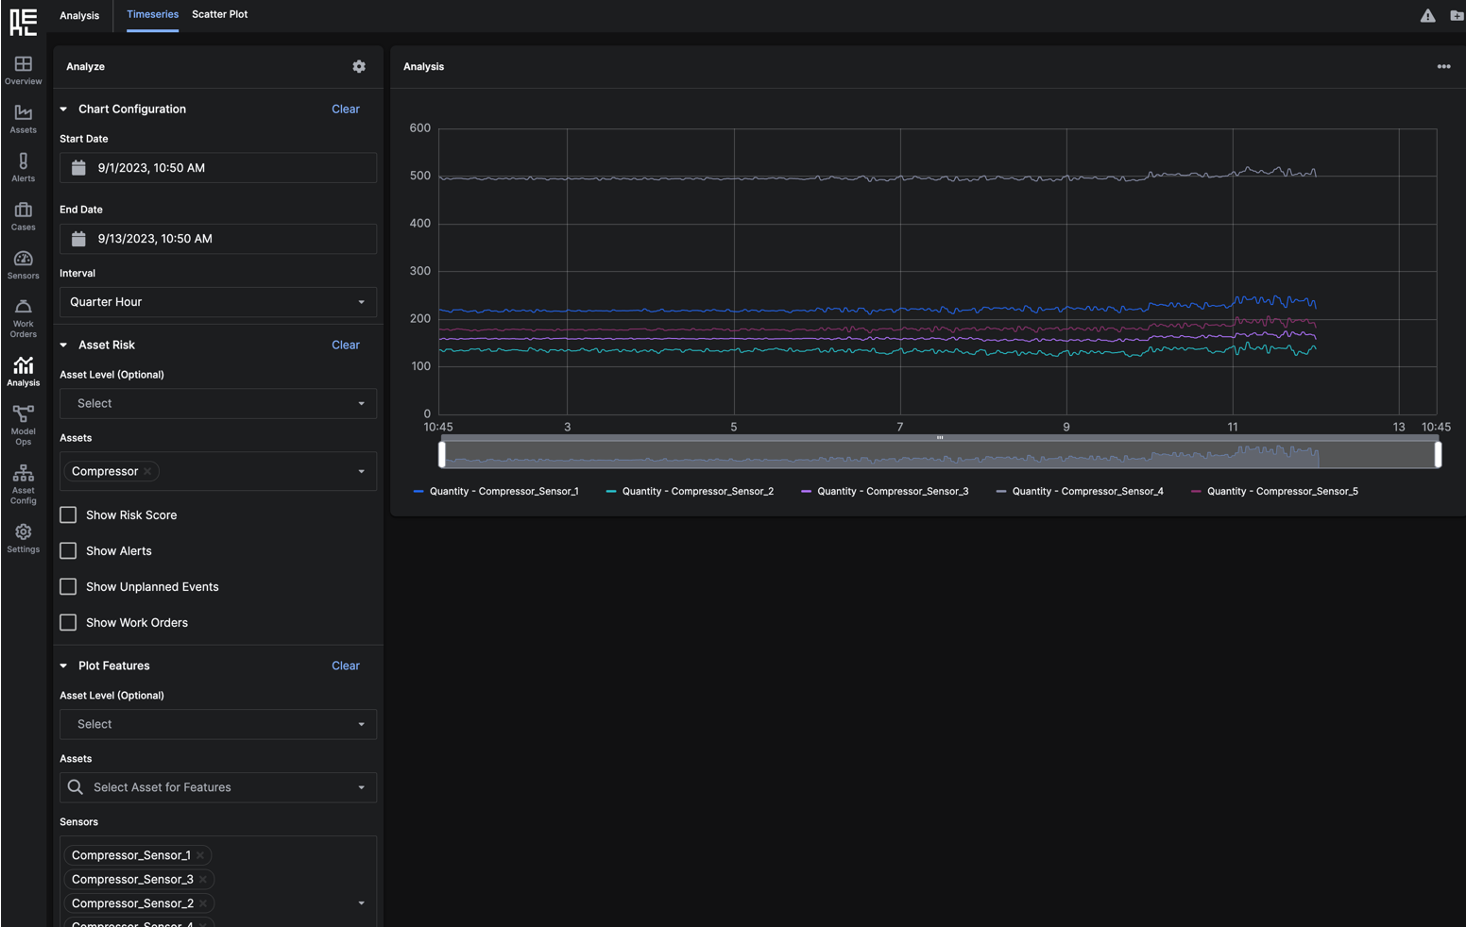 Set the parameters of the graph with the filters on the left side of the window.
Chart Configuration
- Start and End Date: plot time series data from user-specified start and end dates.
- Interval: plot time series data points according to the selected interval (Second, Minute, Five Minute, Ten Minute, Quarter Hour, Half Hour, Hour, Day, Month or Year).
Asset Risk
- Assets: plot time series data for selected
Assets.Assetscan be filtered by Asset Level. - Show Risk Score: displays Risk Score related to the selected
Assets. - Show Alerts: displays
Alertsrelated to the selectedAssets. - Show Unplanned Events - displays events that are related to the selected
Assets. - Show Work Orders: displays
Work Orderscreated for to the selectedAssets.
Plot Features
- Asset Level/Assets: filter the list of Features for selection
- Sensors: displays a list of Features available for plotting
Feature Reconstruction or Show Feature Contributions to Reliability Risk Score if you want to include these features in your search results.
Asset KPIs
You can also select company specified metrics to plot. These metrics must be pre-configured by your Center of Excellence team.Saving a Chart
You can save the configuration of a plotted chart by clicking on the configuration (gear) in the top right of the filter panel. This allows you to reference the same chart at a future time.Scatter Plot Charts
Use the scatter plot graph to group sets of data by color.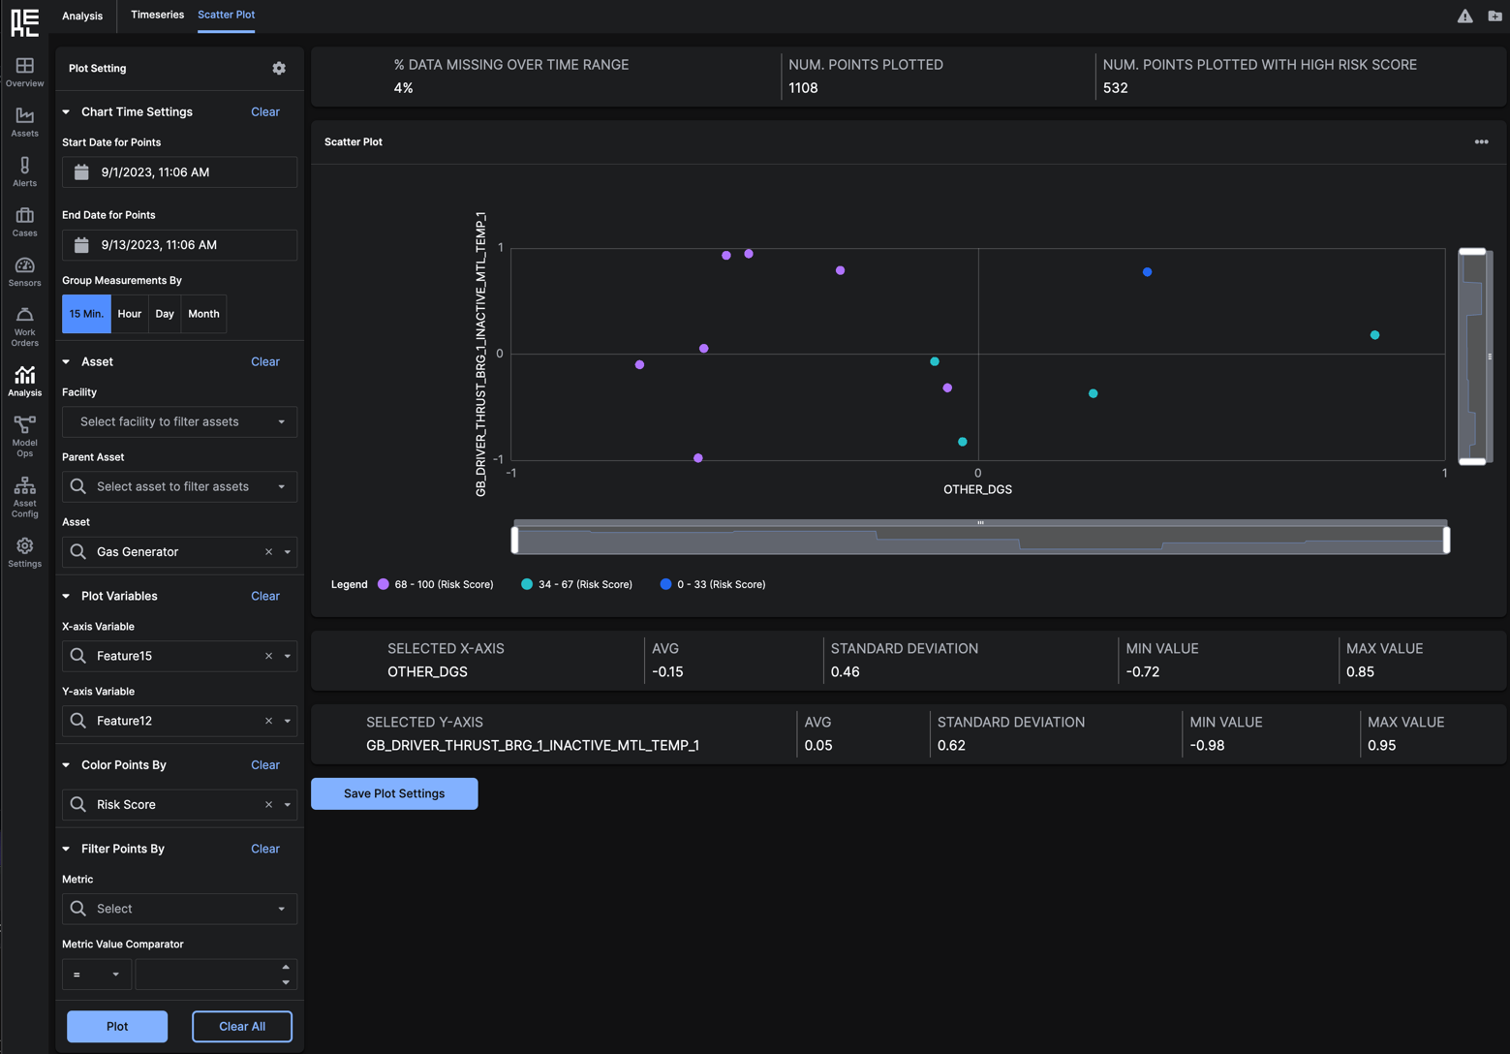 Set the parameters of the graph with the filters on the left side of the window.
Chart Time Settings
- Start and End Date: plot data from user-specified start and end dates.
- Group Measurements By: Choose the interval by which you want to group assets. Options include: 15 Min., Hour, Day, or Month.
Asset
- Facility: Select a Facility to filter the
Assetto plot - Parent Asset: Select a Parent
Assetto filter theAssetto plot - Asset: Choose the
Assetto plot in your graph
Plot Variables
- X-Axis Variable: Plot the data for chosen feature on the x-axis of the chart.
- Y-Axis Variable: Plot the data for the chosen feature on the y-axis of the chart.
Color Points By
You can color sets of points by:- Year
- Month
- Quarter
- Risk Score
- % Data Missing
Filter Points By
You can choose to exclude some of the data in the data by specifying a Feature and an associated threshold. This could help in only viewing data when your operations are running normally.Saving a Chart
You can save the configuration of a plotted chart by clicking on the configuration (gear) in the top right of the filter panel. This allows you to reference the same chart at a future time.Custom Metrics (Beta)
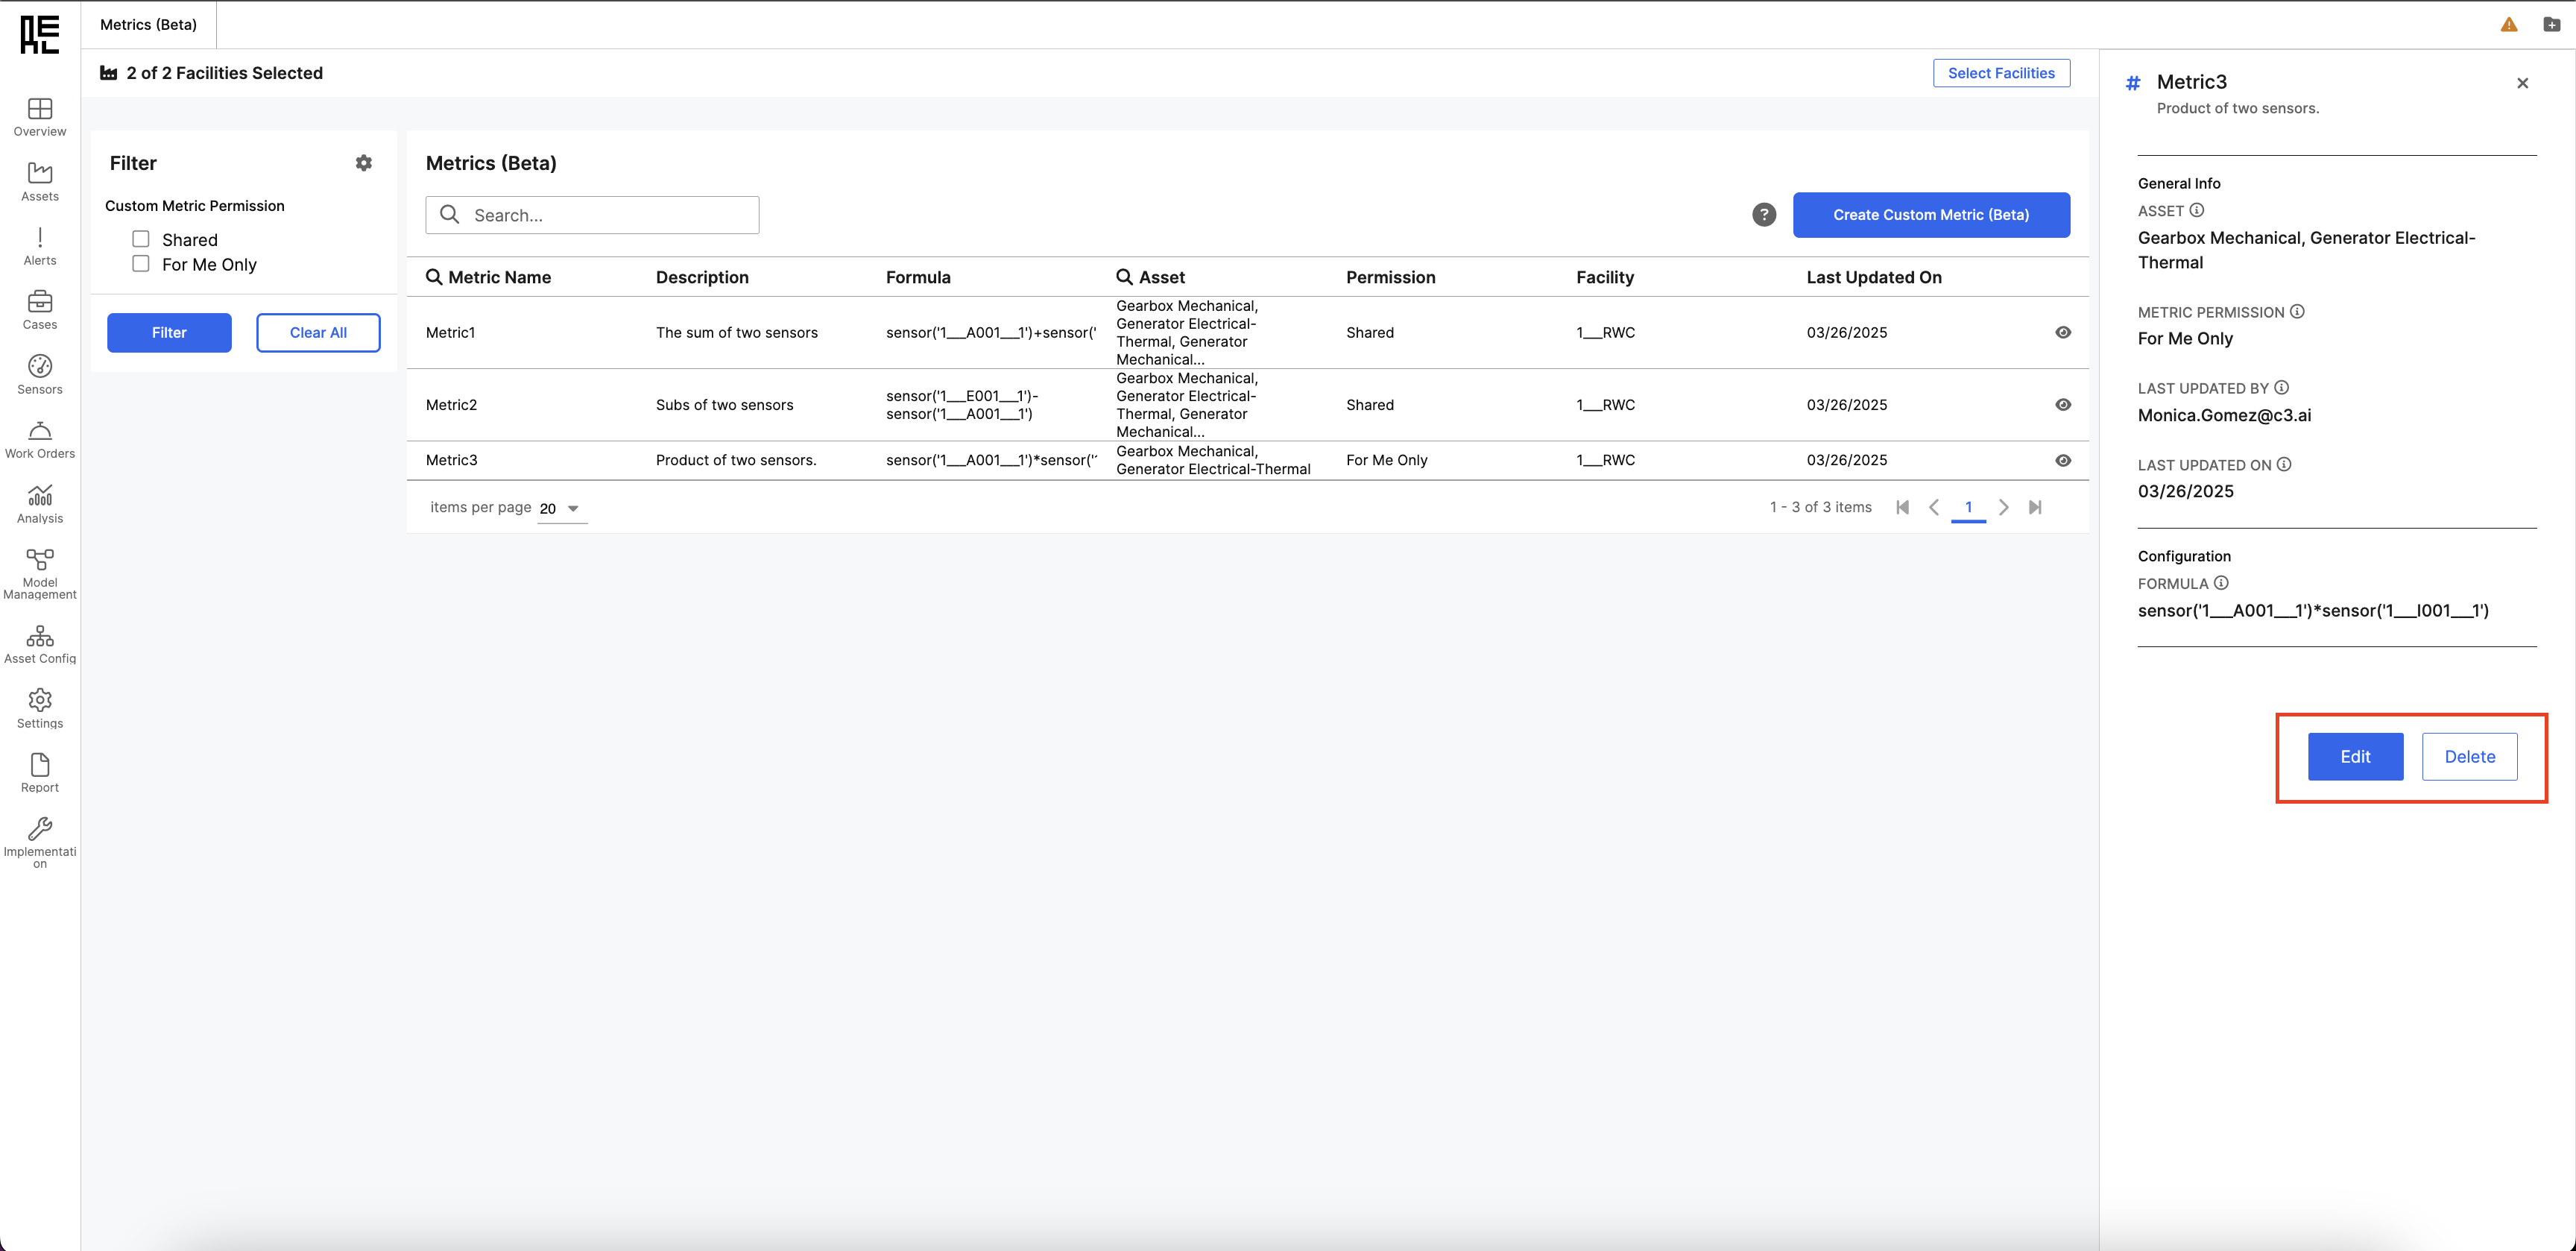
Custom Metrics, or Metric Configuration, is a feature that enables you to create, manage, and view custom-defined metrics for use in analysis.Metrics Library
The Metrics Library allows users to create, manage, and view custom metrics for analysis and tracking.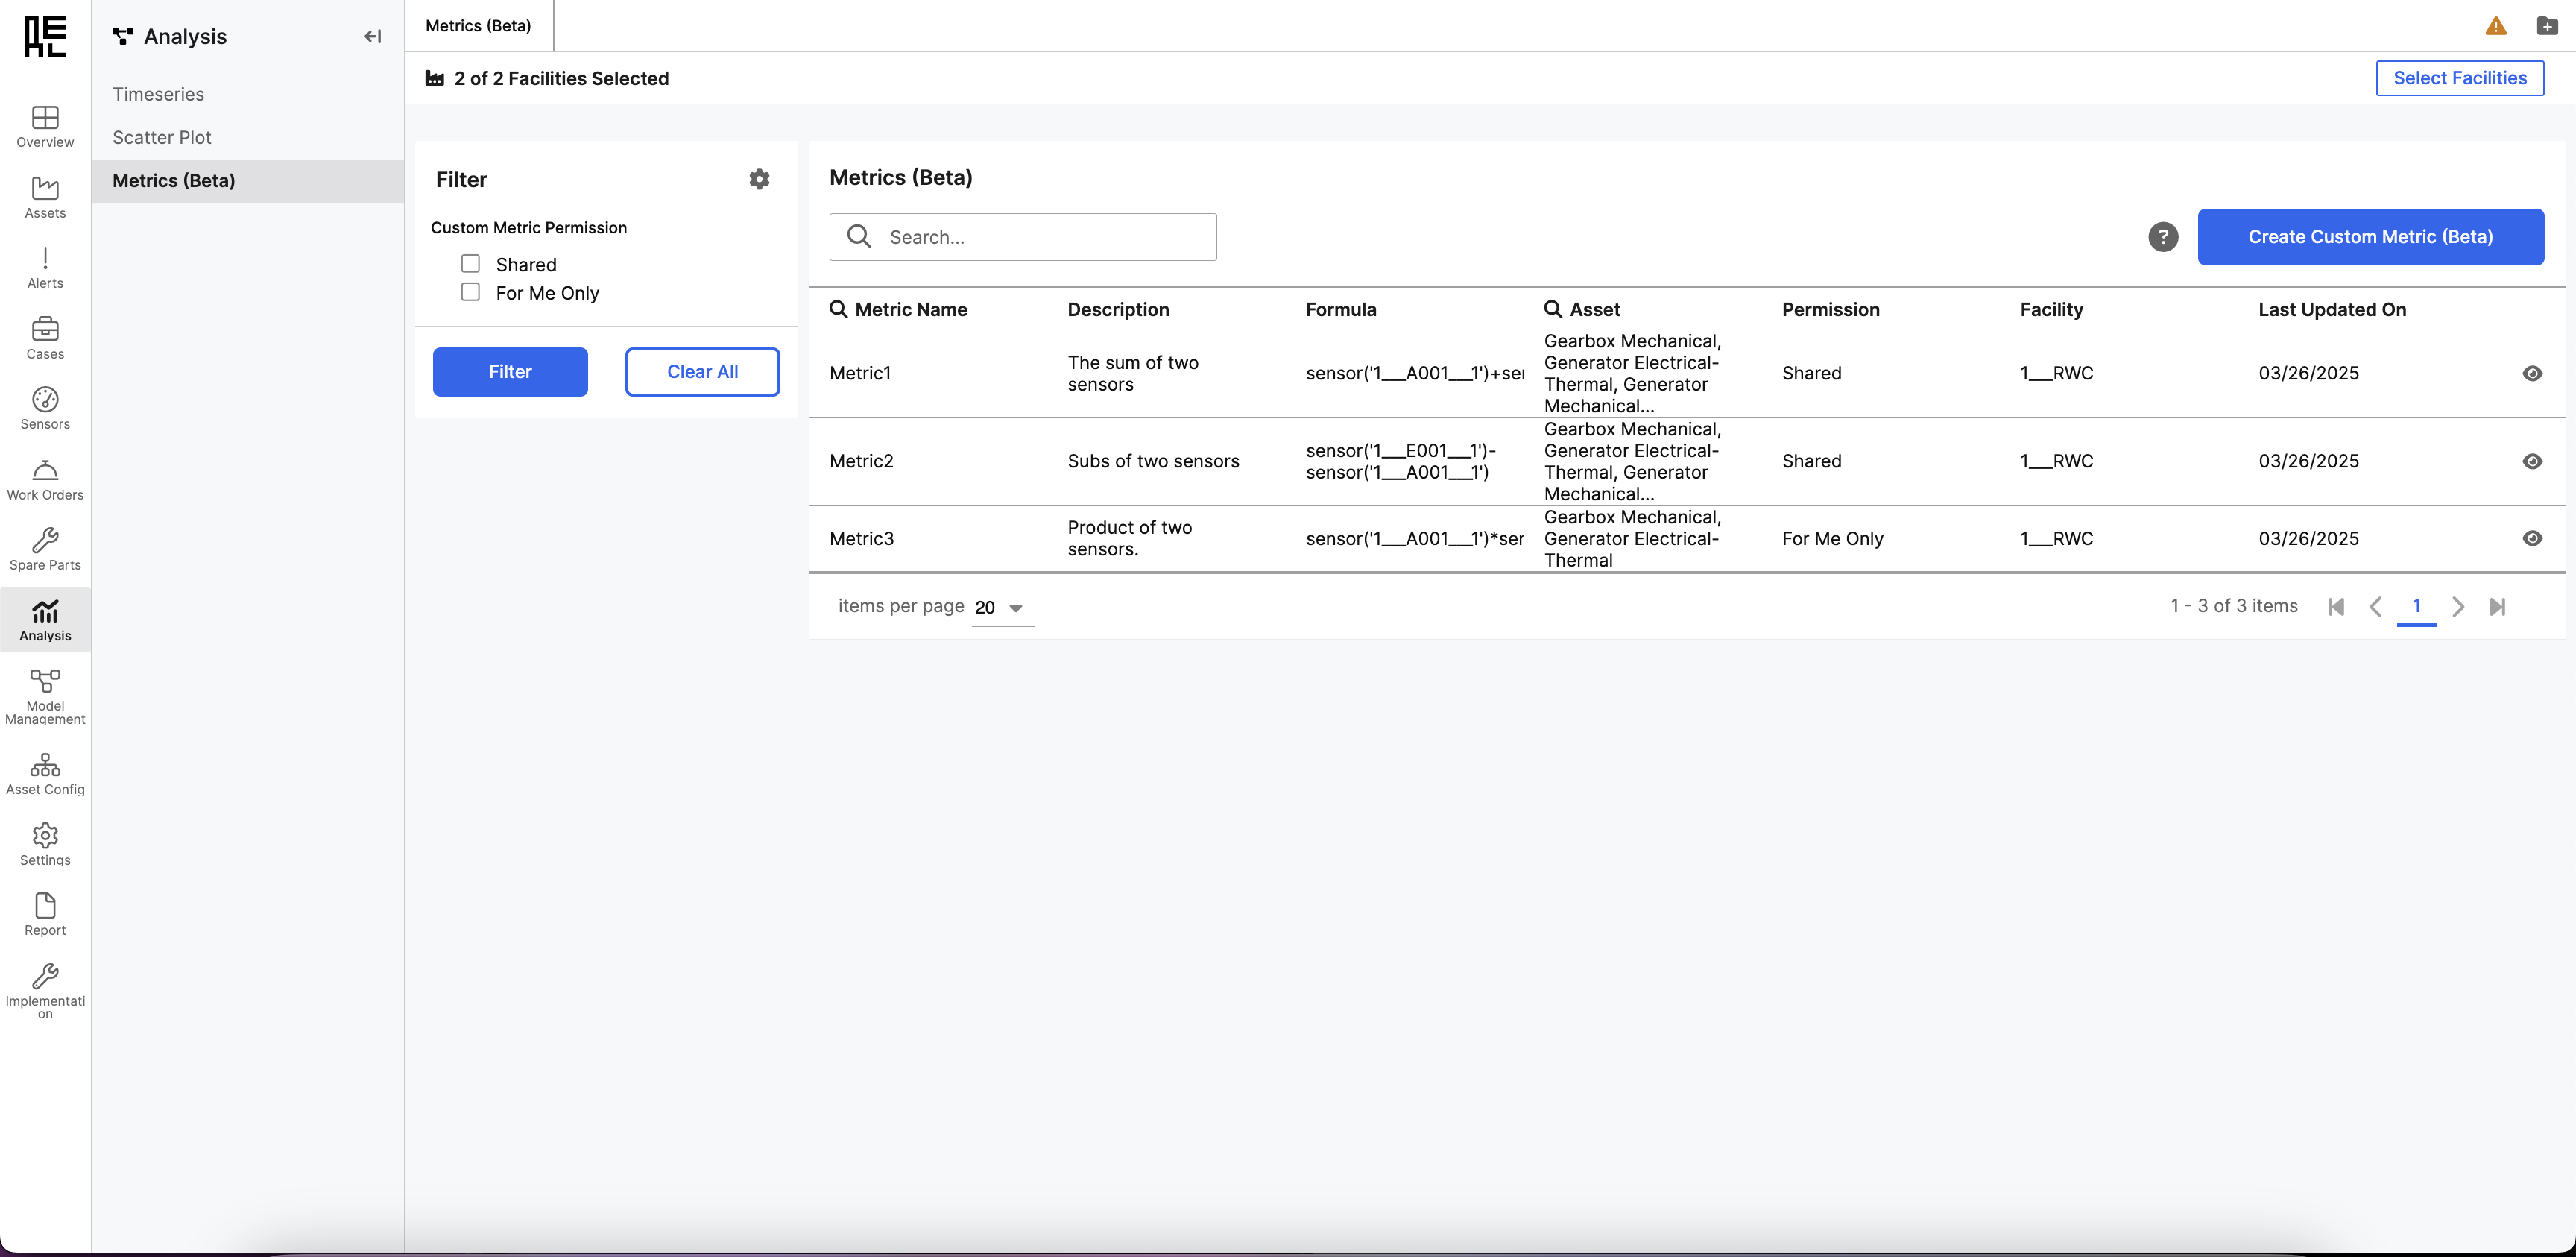 Metrics can be:
- For Me Only (Private): Only visible/editable by you.
- Shared (Public): These are available to all users; they can’t be edited/deleted.
- Metric Name
- Description or brief explanation of the metric
- A formula that represents the mathematical expression used
- Assets represent the associated equipment. Depending on the sensor IDs or metrics used in the equation, a metric can be attached to one or multiple assets.
- Permission determines who can view, edit, or delete the metric
- The facility field determines which facility’s asset sensors can be used when creating the metric. Users must have access to the selected facility to view its sensors and create associated metrics.
- Last Updated On, represents the date when the metric was last modified.
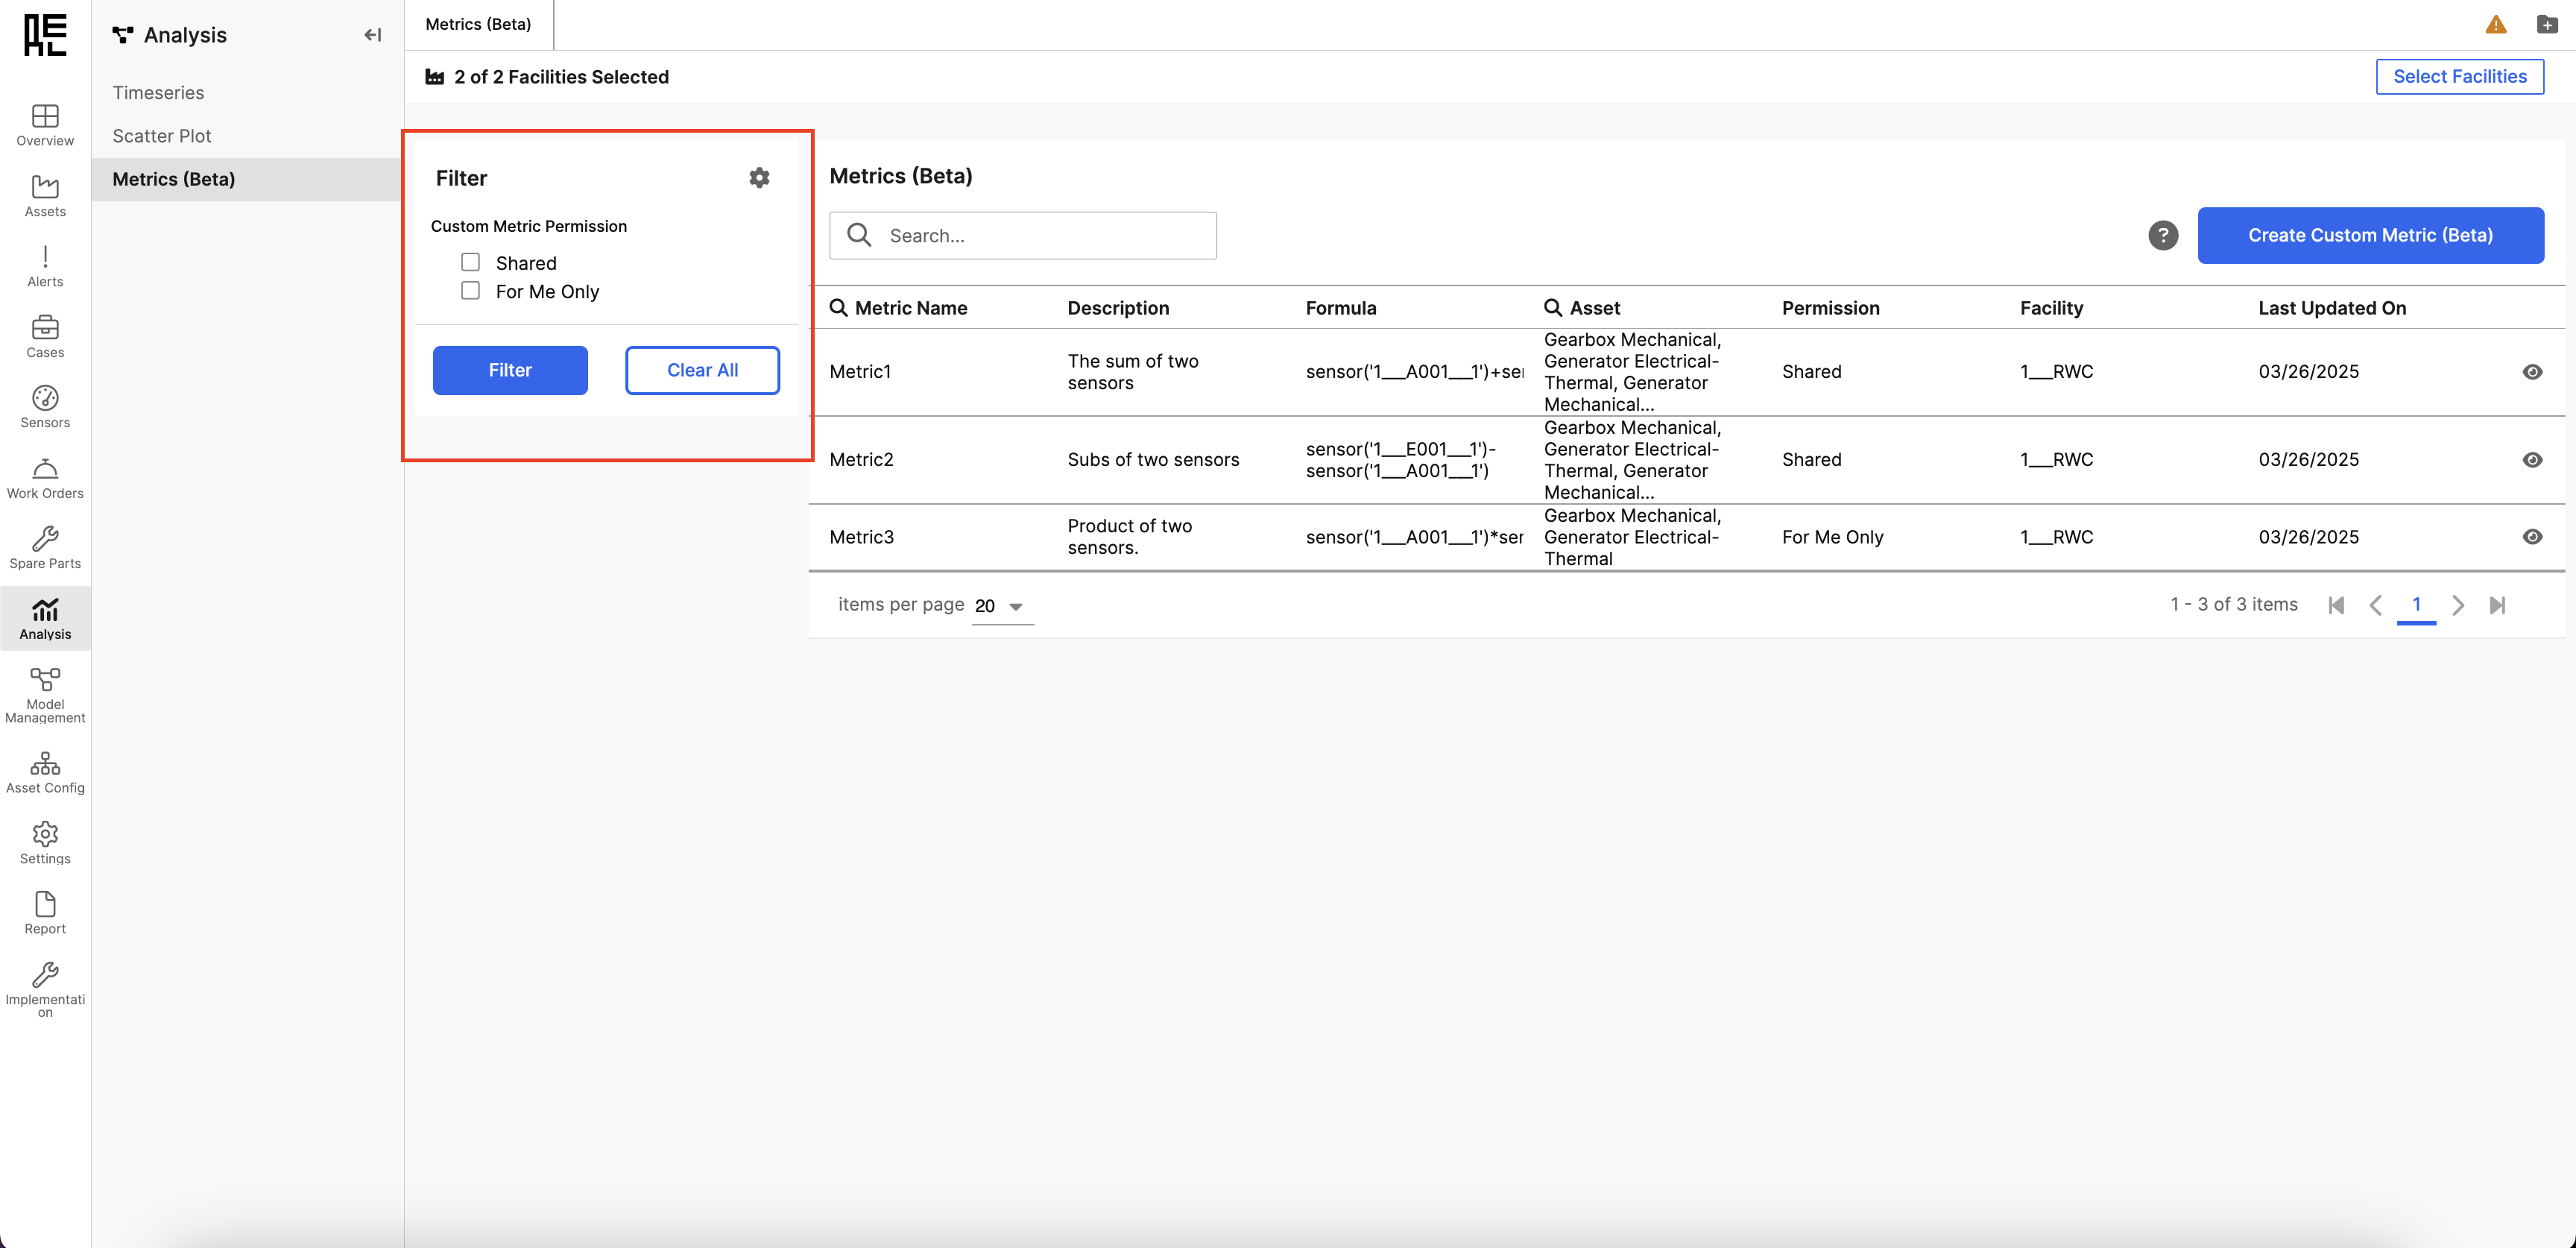
Searching & Filtering
Filter by facility: The facility global filter above the page allows the user to filter only the metrics belonging to the facility to which the user has access.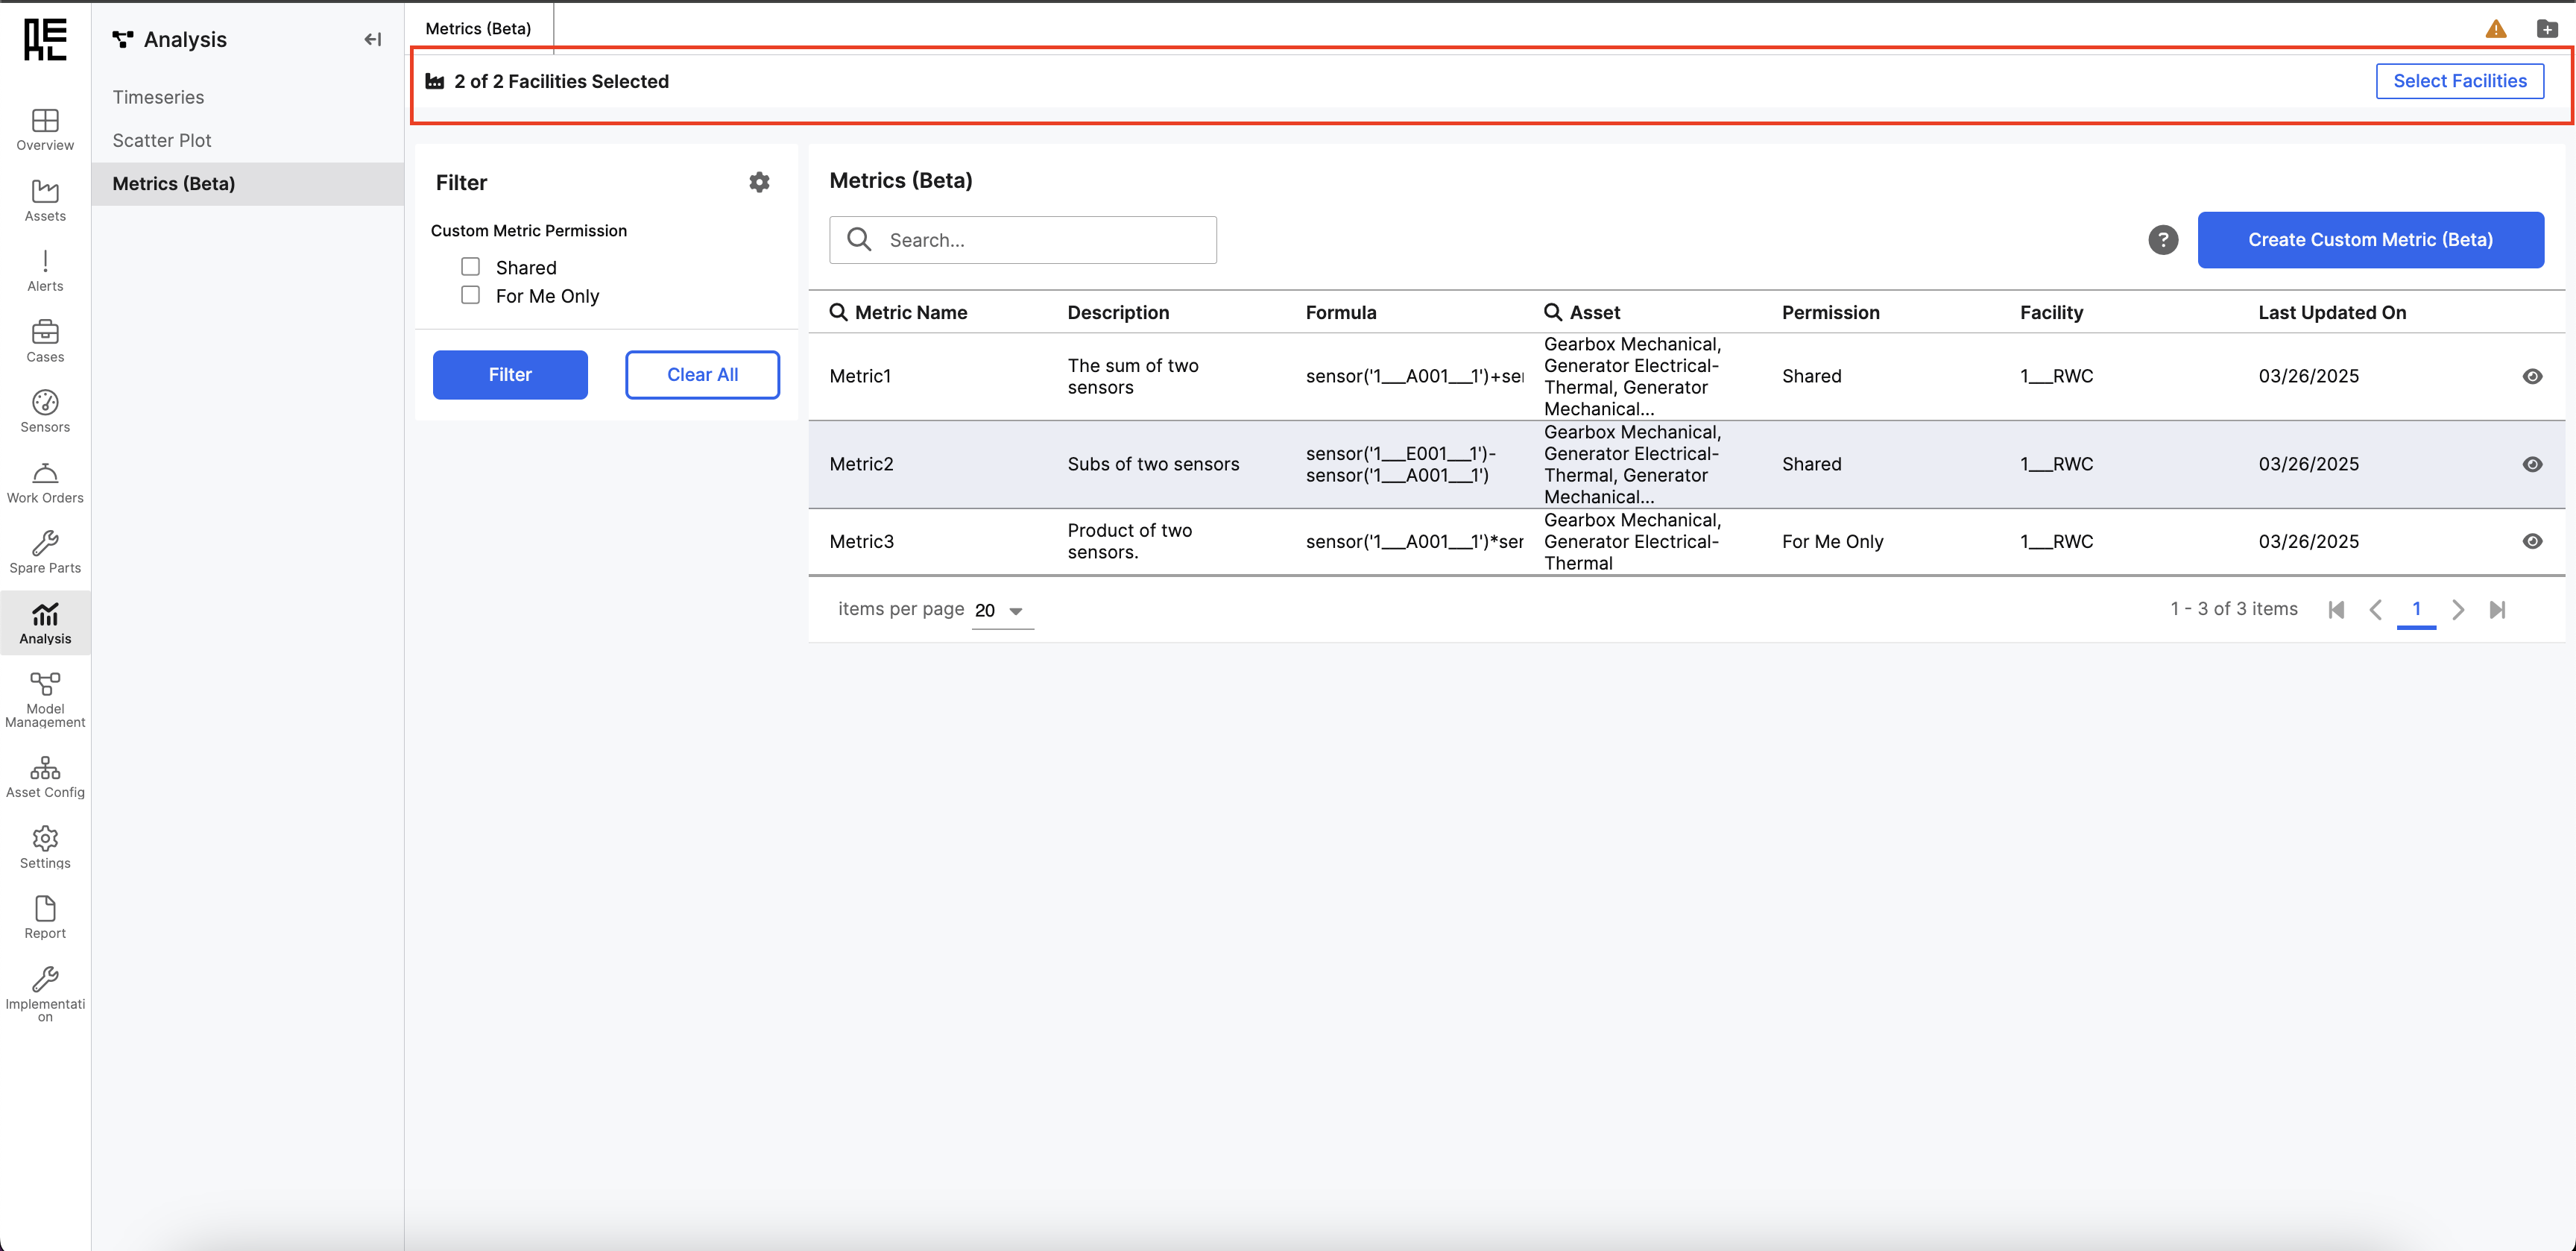 Search by: Name, or Asset.
Filter by permission: Shared or For Me Only metrics using the filter panel on the left side of the screen.
Search by: Name, or Asset.
Filter by permission: Shared or For Me Only metrics using the filter panel on the left side of the screen.
Create a custom metric
If the metric need isn’t found, click “Create Custom Metric” in the top right corner to define a new one.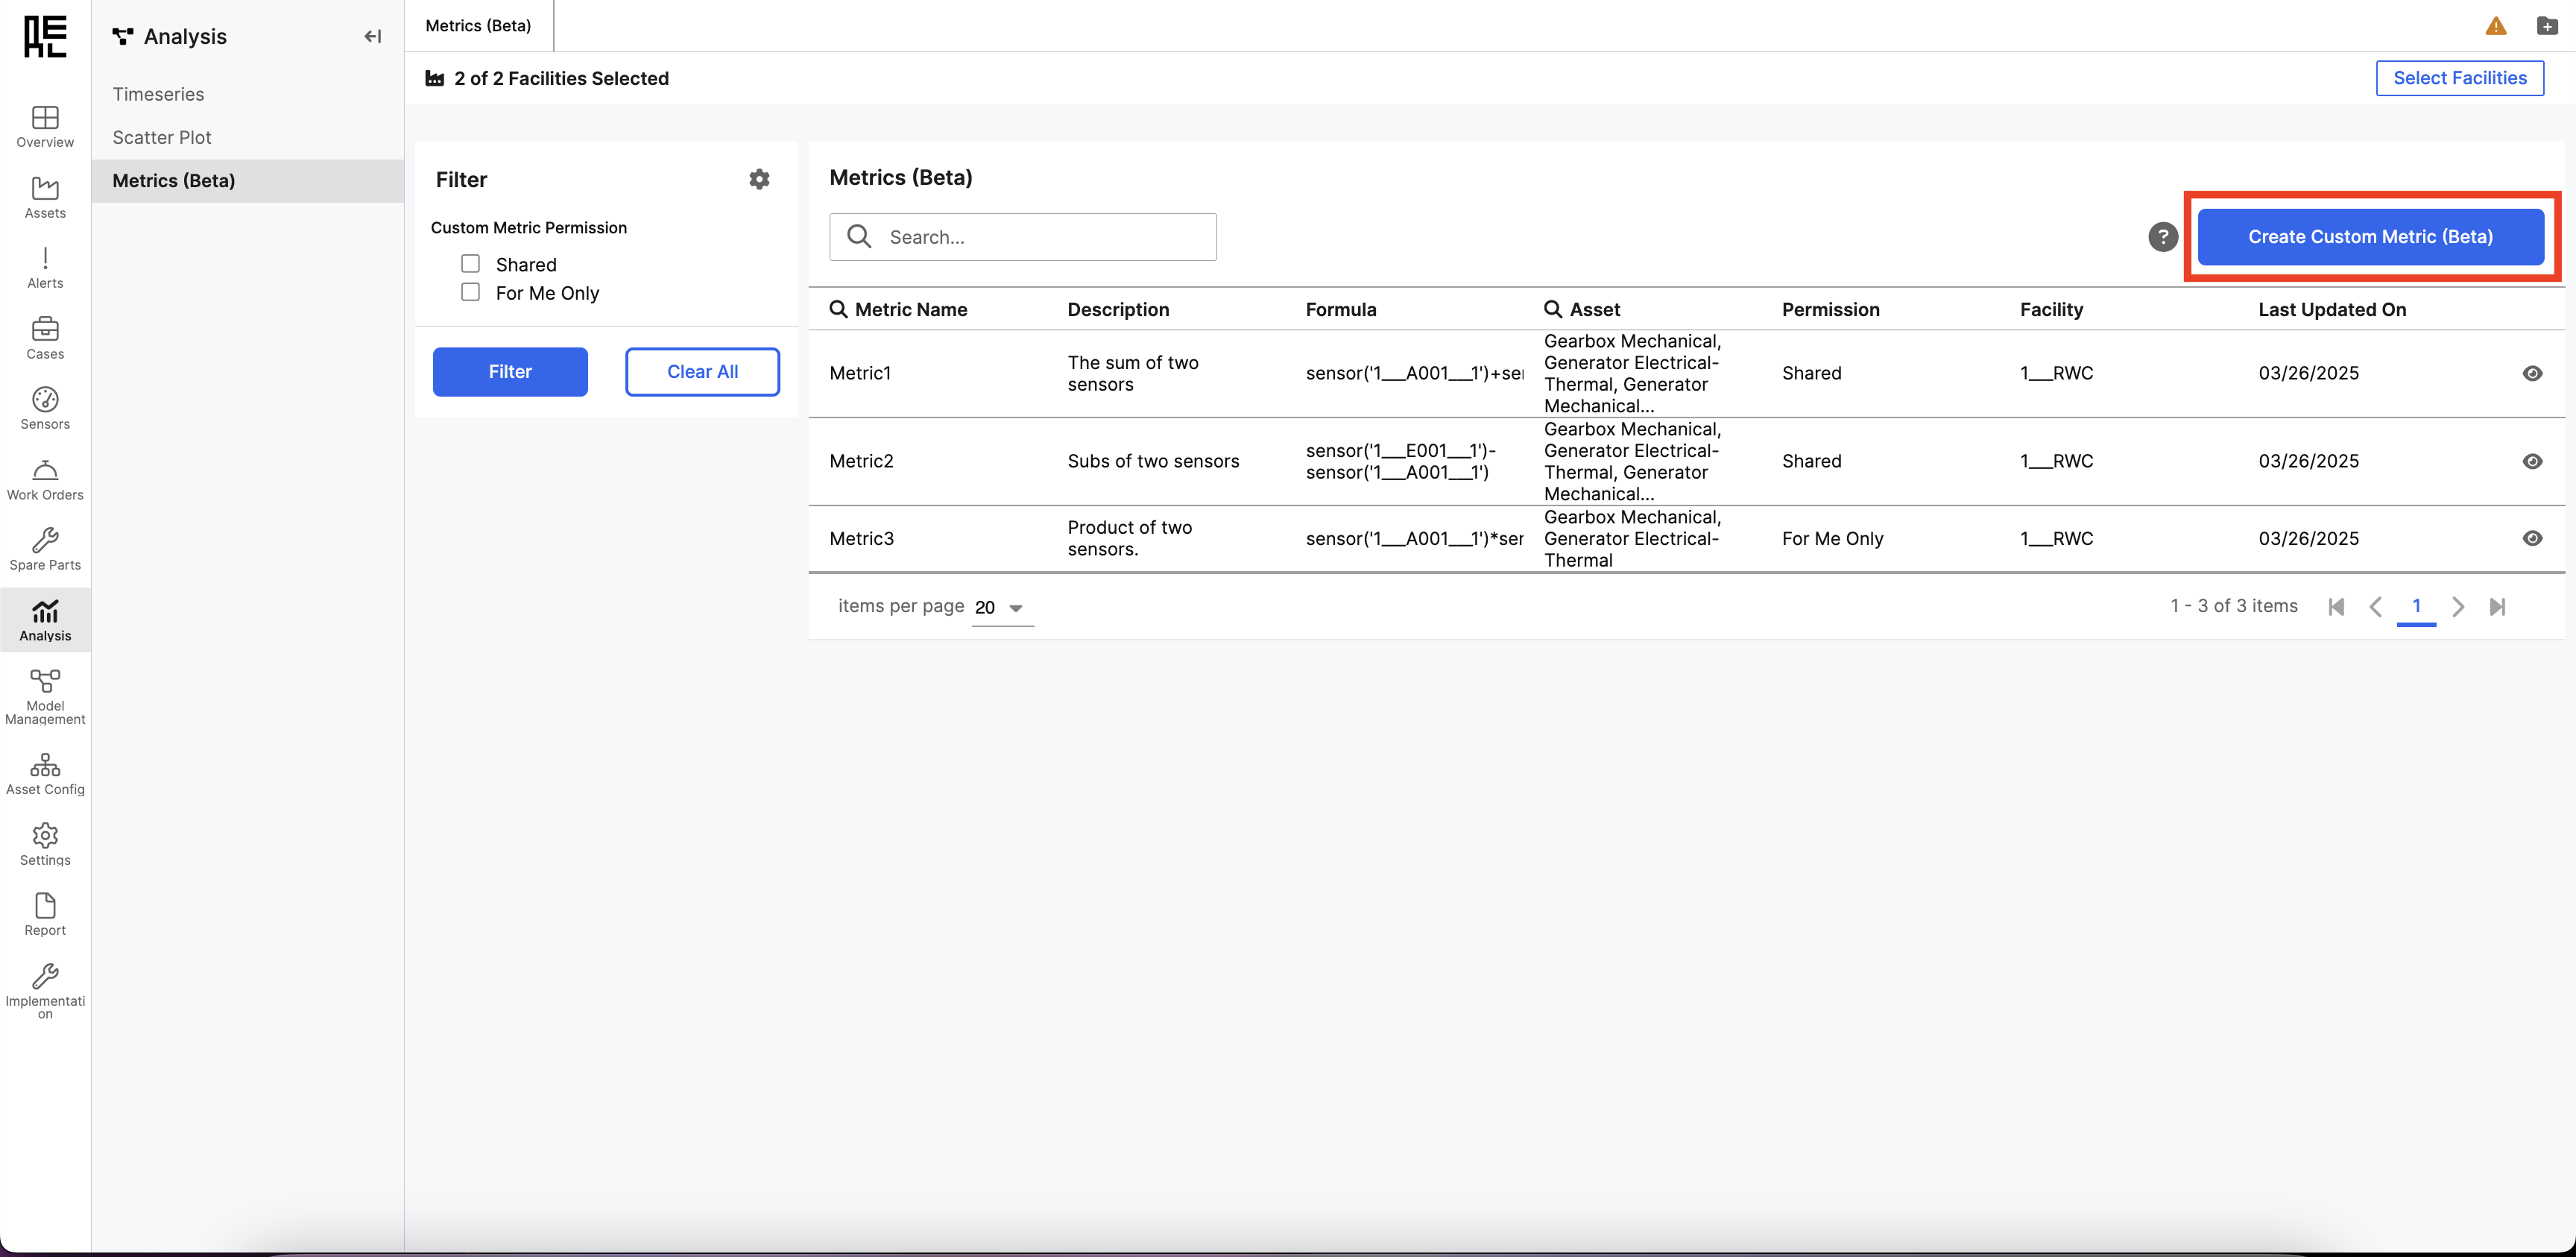
Viewing & Interacting with Metrics
Hover over the formula to see a clearer view of the equation, and select the eye icon to open a side panel where more readable metric information will be available.Help Side Panel
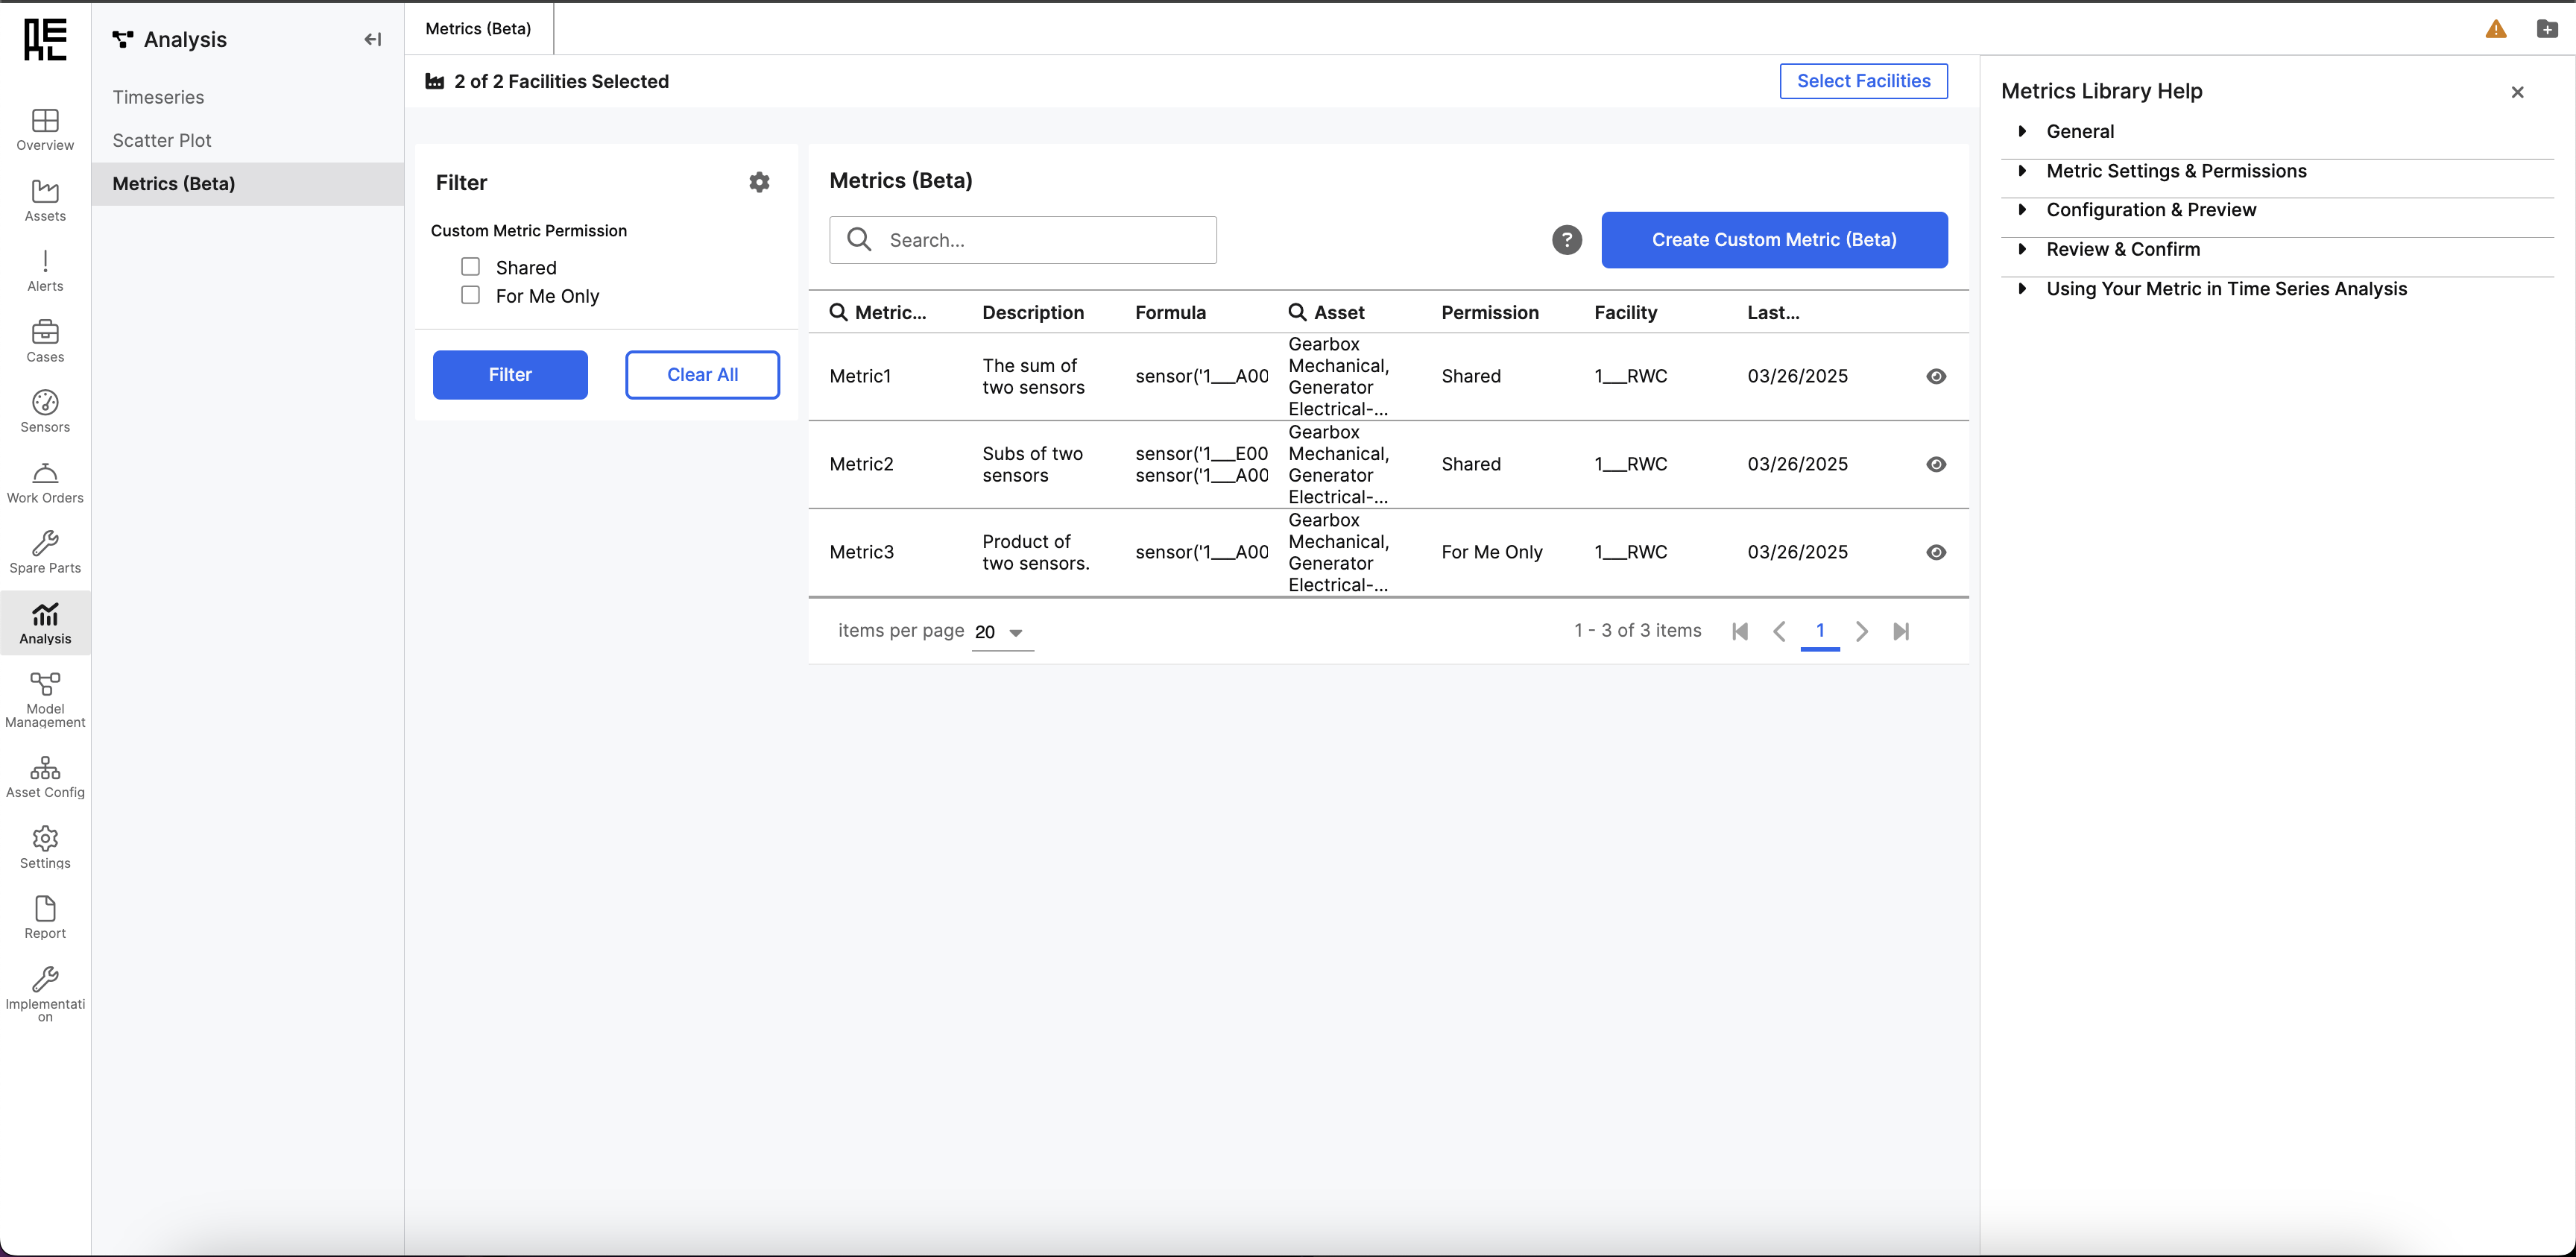
This panel provides usable information for the user when the user needs information about the Custom Metric Feature. To access it, select the question mark icon ”?” at the top right corner of the Metrics Library grid.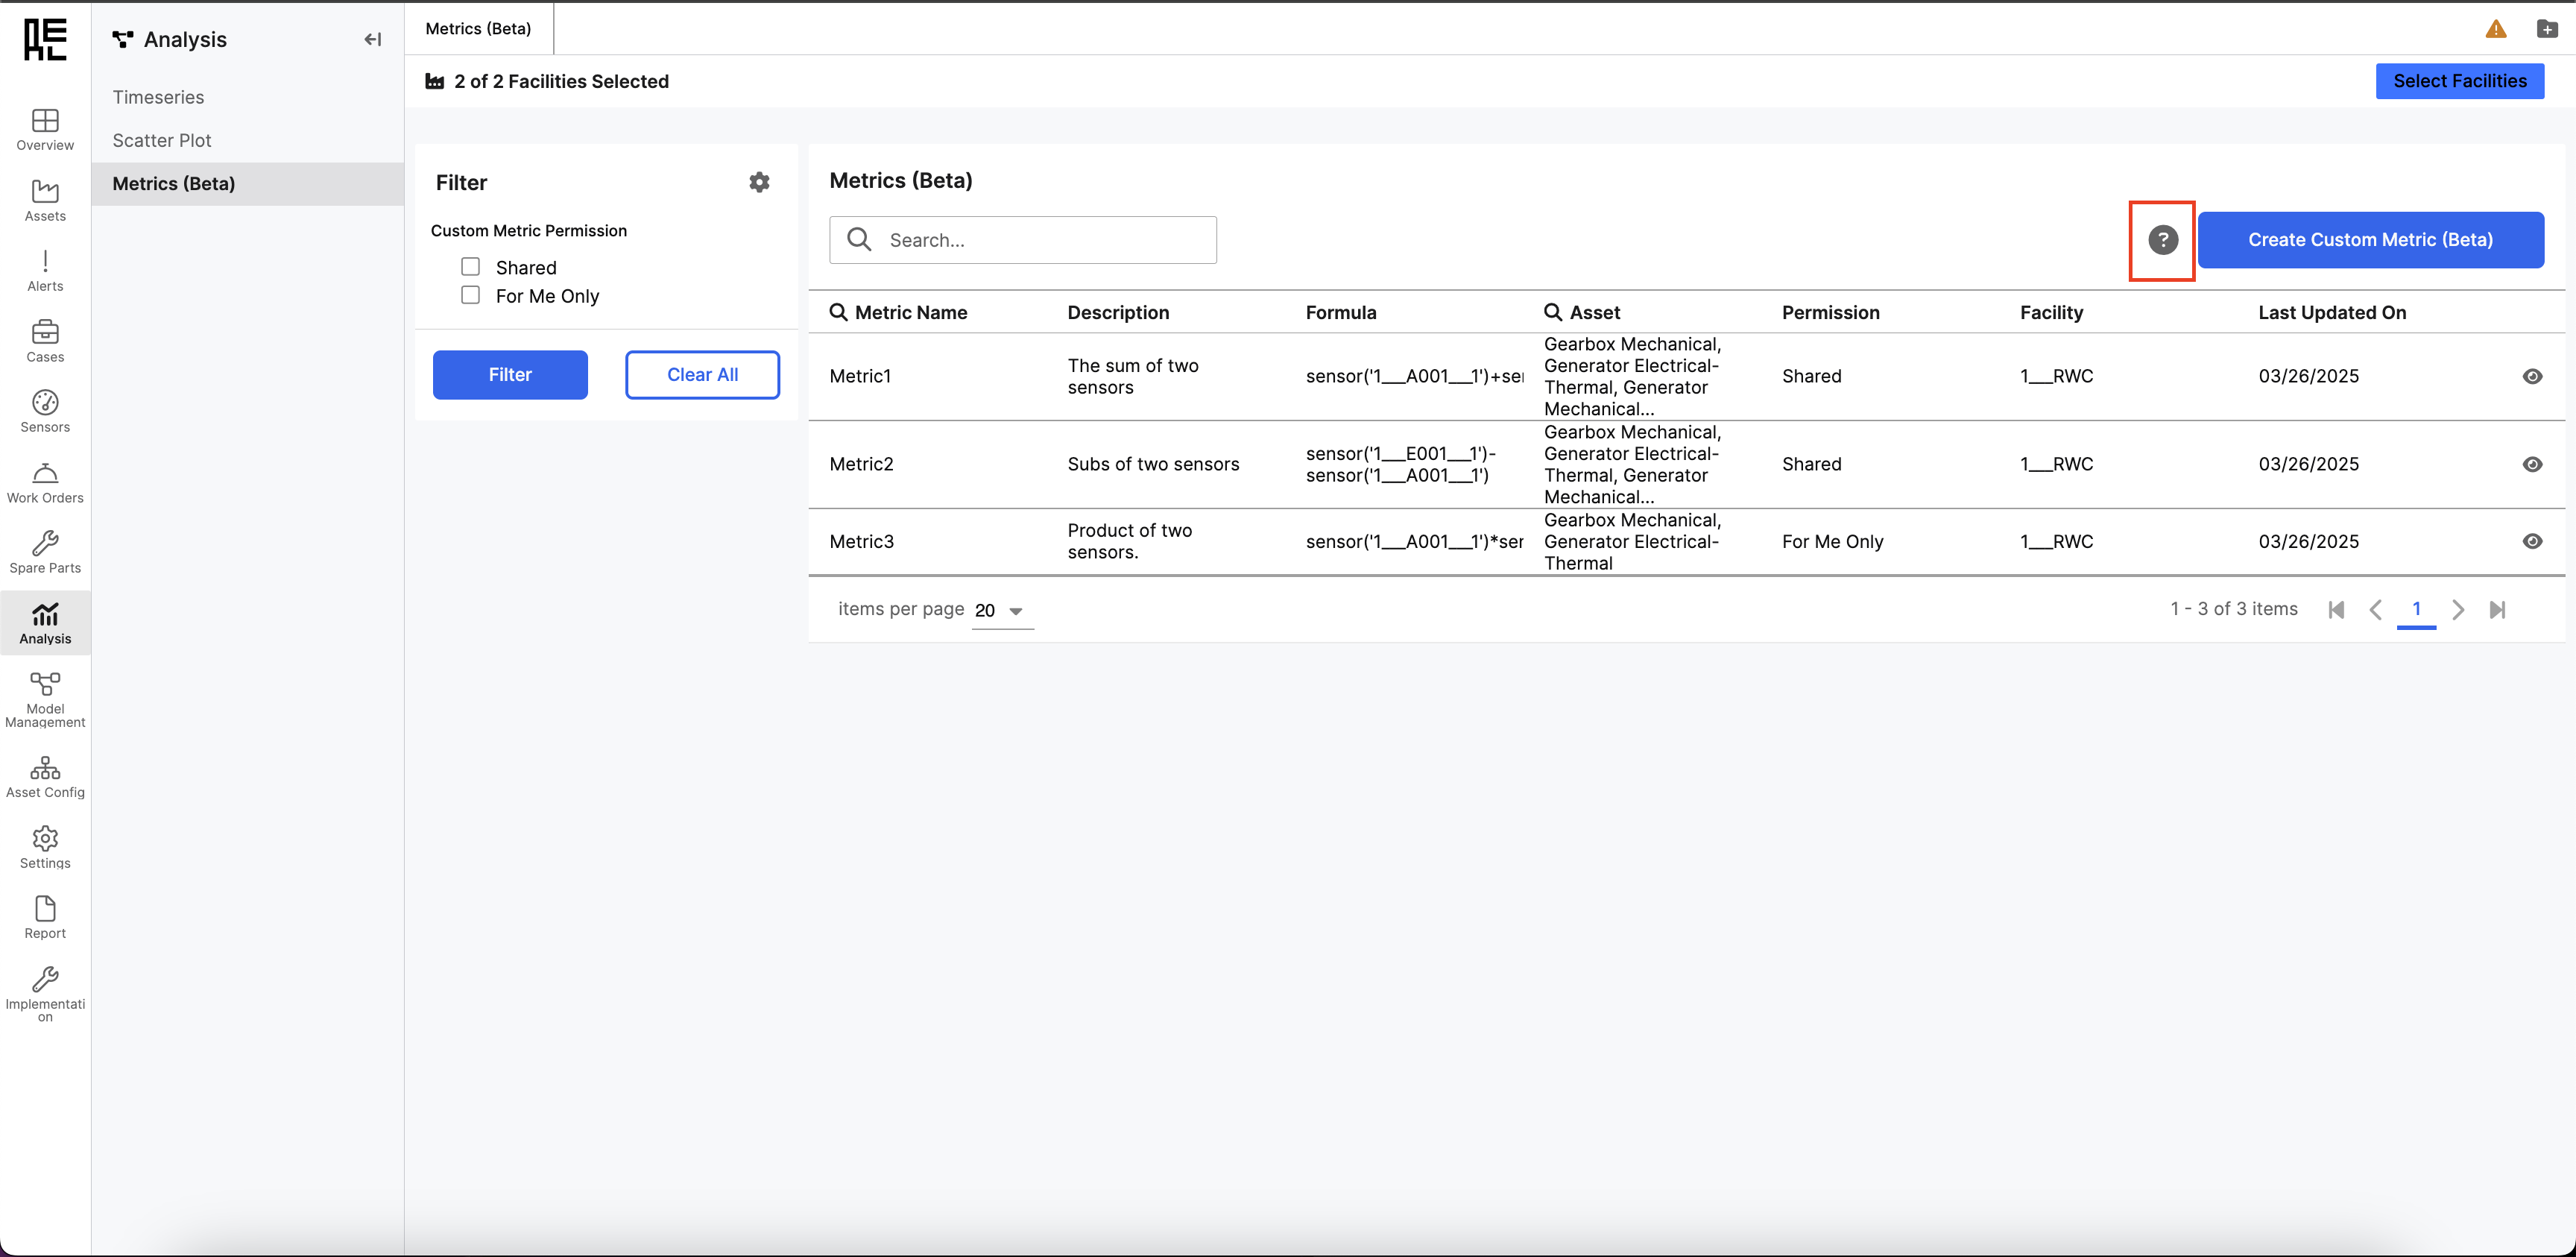 When it’s open, it shows different information in collapsible sections, which makes navigation easier. Each section provides valuable information, improving the user experience.
Create a New Metric
Metric Settings & Permissions
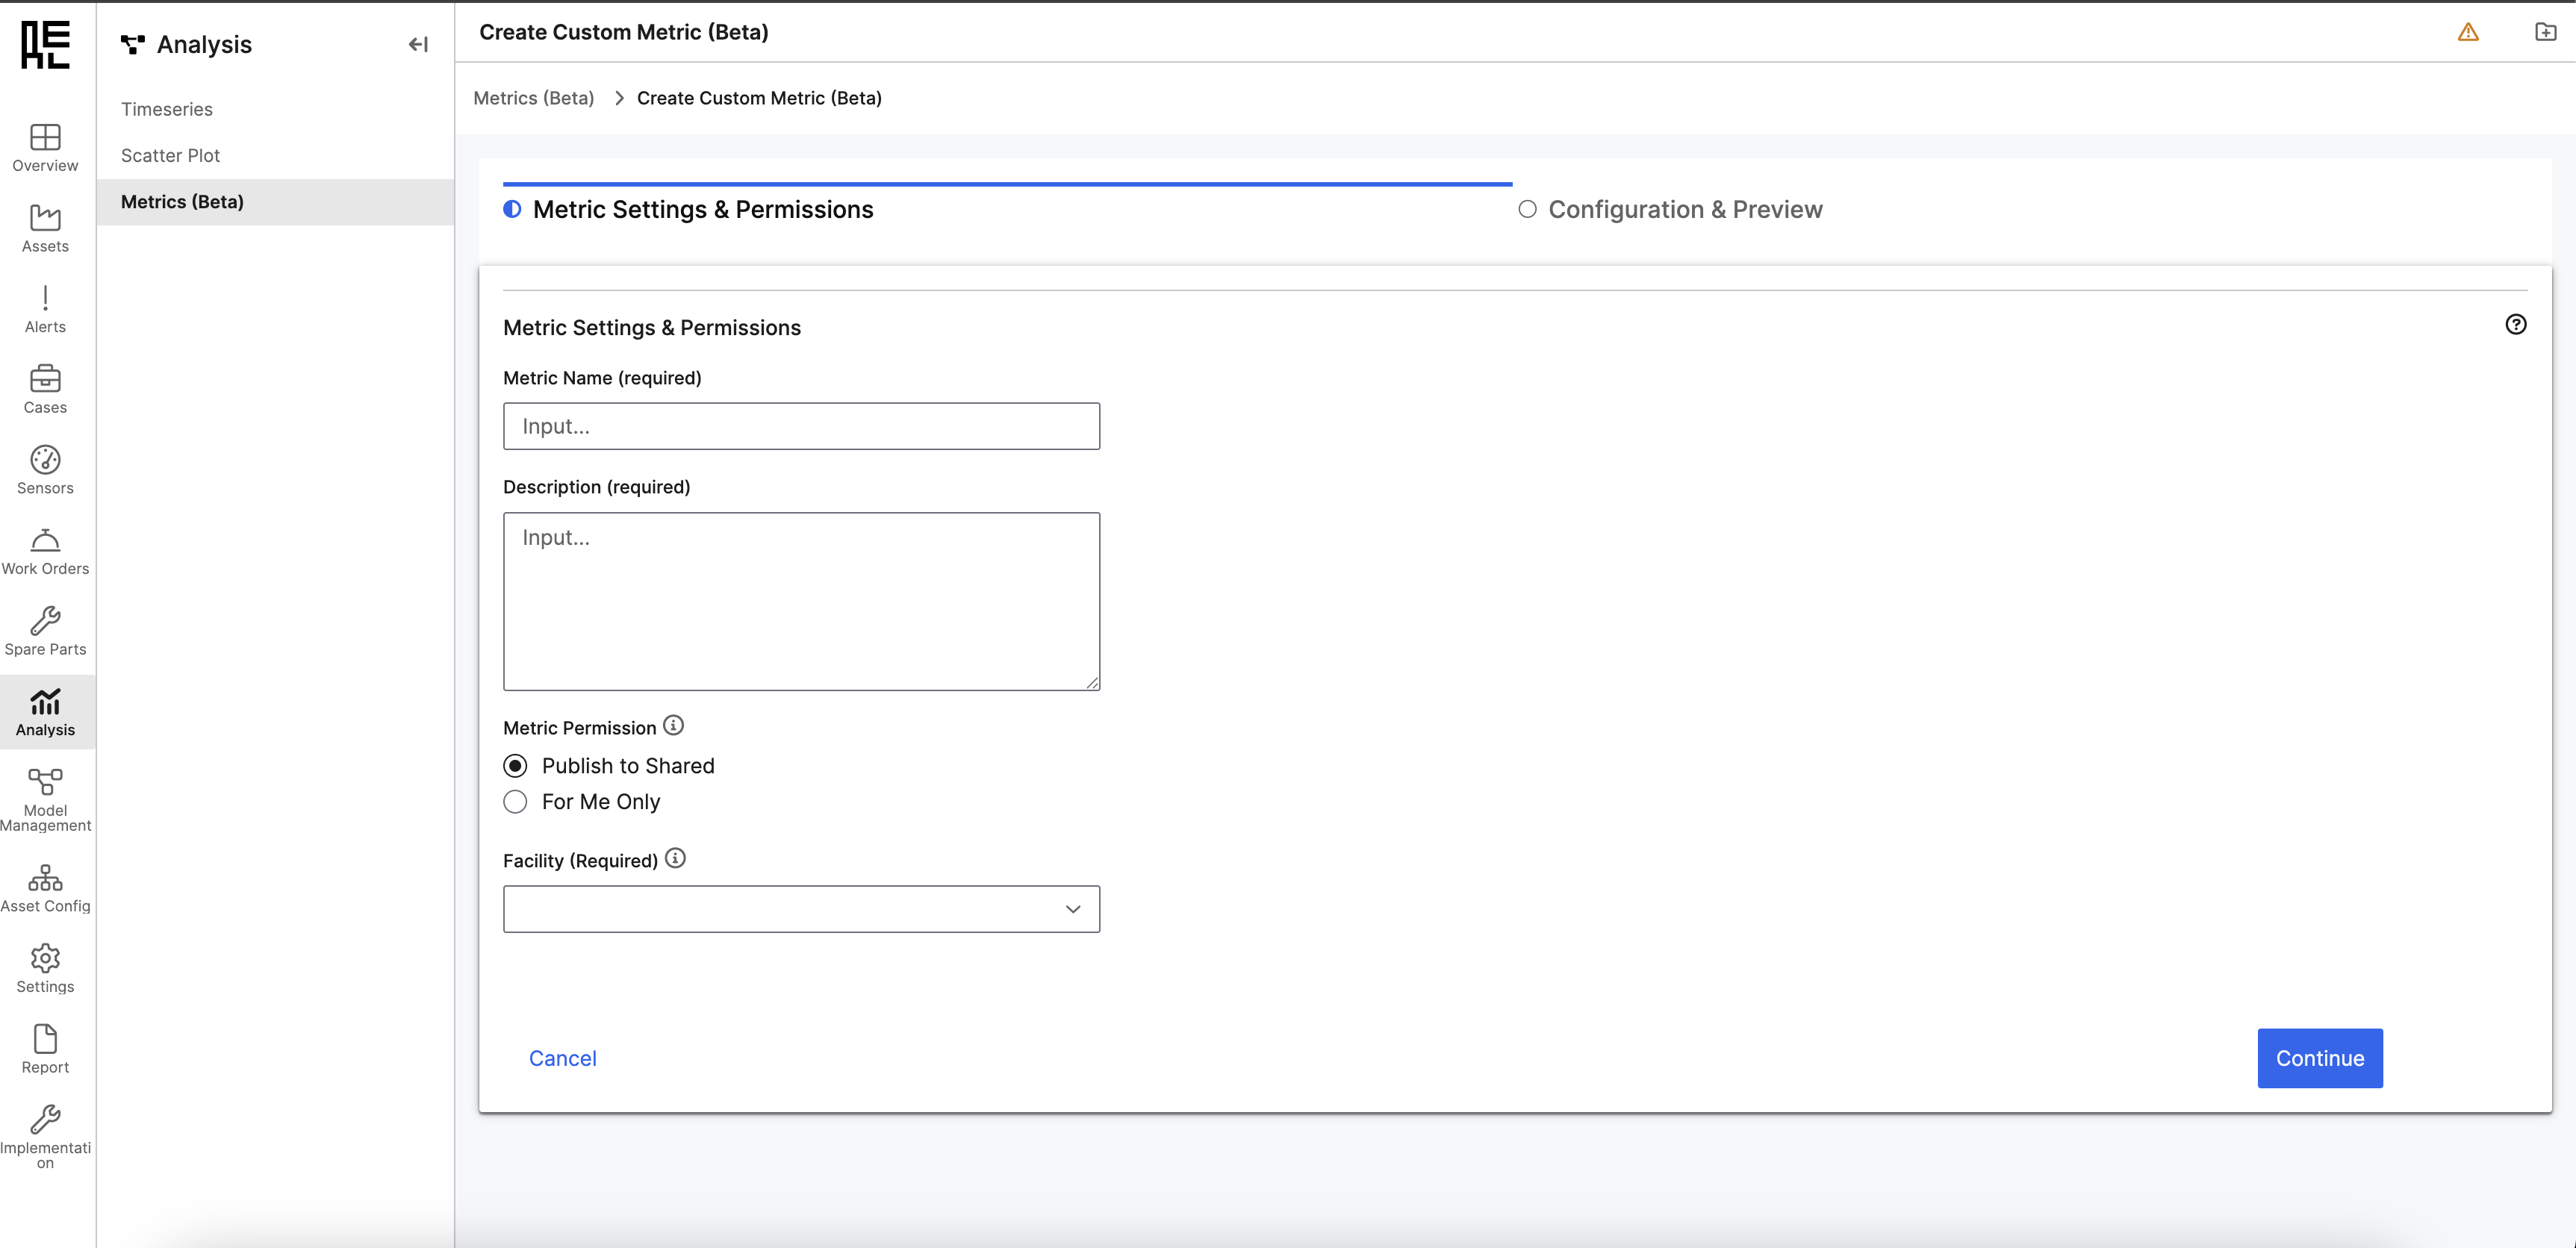
Metric Name
- Enter a unique name for the metric.
- Allowed characters: Letters (A-Z, a-z), numbers (0-9), and underscores (_) only.
- Choose a clear and descriptive name that will be easy to find in the library.
Description
- Provide a brief but clear explanation of the metric”s purpose. Example: “Average reactor inlet flow” instead of “Avg Flow.”
- This helps users understand the metric without needing to analyze its formula.
Metric Permissions
Users must choose whether their metric will be Public (Shared) or Private (For Me Only).-
Publish to Shared (Public):
- The metric will be available for all users.
- Other users can use it in formulas.
- Once published, only an admin can modify or delete it.
-
For Me Only (Private)
- The metric will be visible only to the creator.
- Users can edit, delete, or later promote it to the public.
- Other users can’t use it in their calculations.
- All components retain their original permissions if a private metric is used in a new private formula.
- If a private metric is used in a new public formula, all dependent private metrics are automatically promoted to public when published.
Facility
The user selects the facility the metric belongs to. This selection determines which sensors and existing metrics are available to use in the formula. Next Steps- Select “Cancel” to exit without saving.
- Select “Continue” to proceed to Configuration & Preview.
Configuration & Preview
Metric Configuration
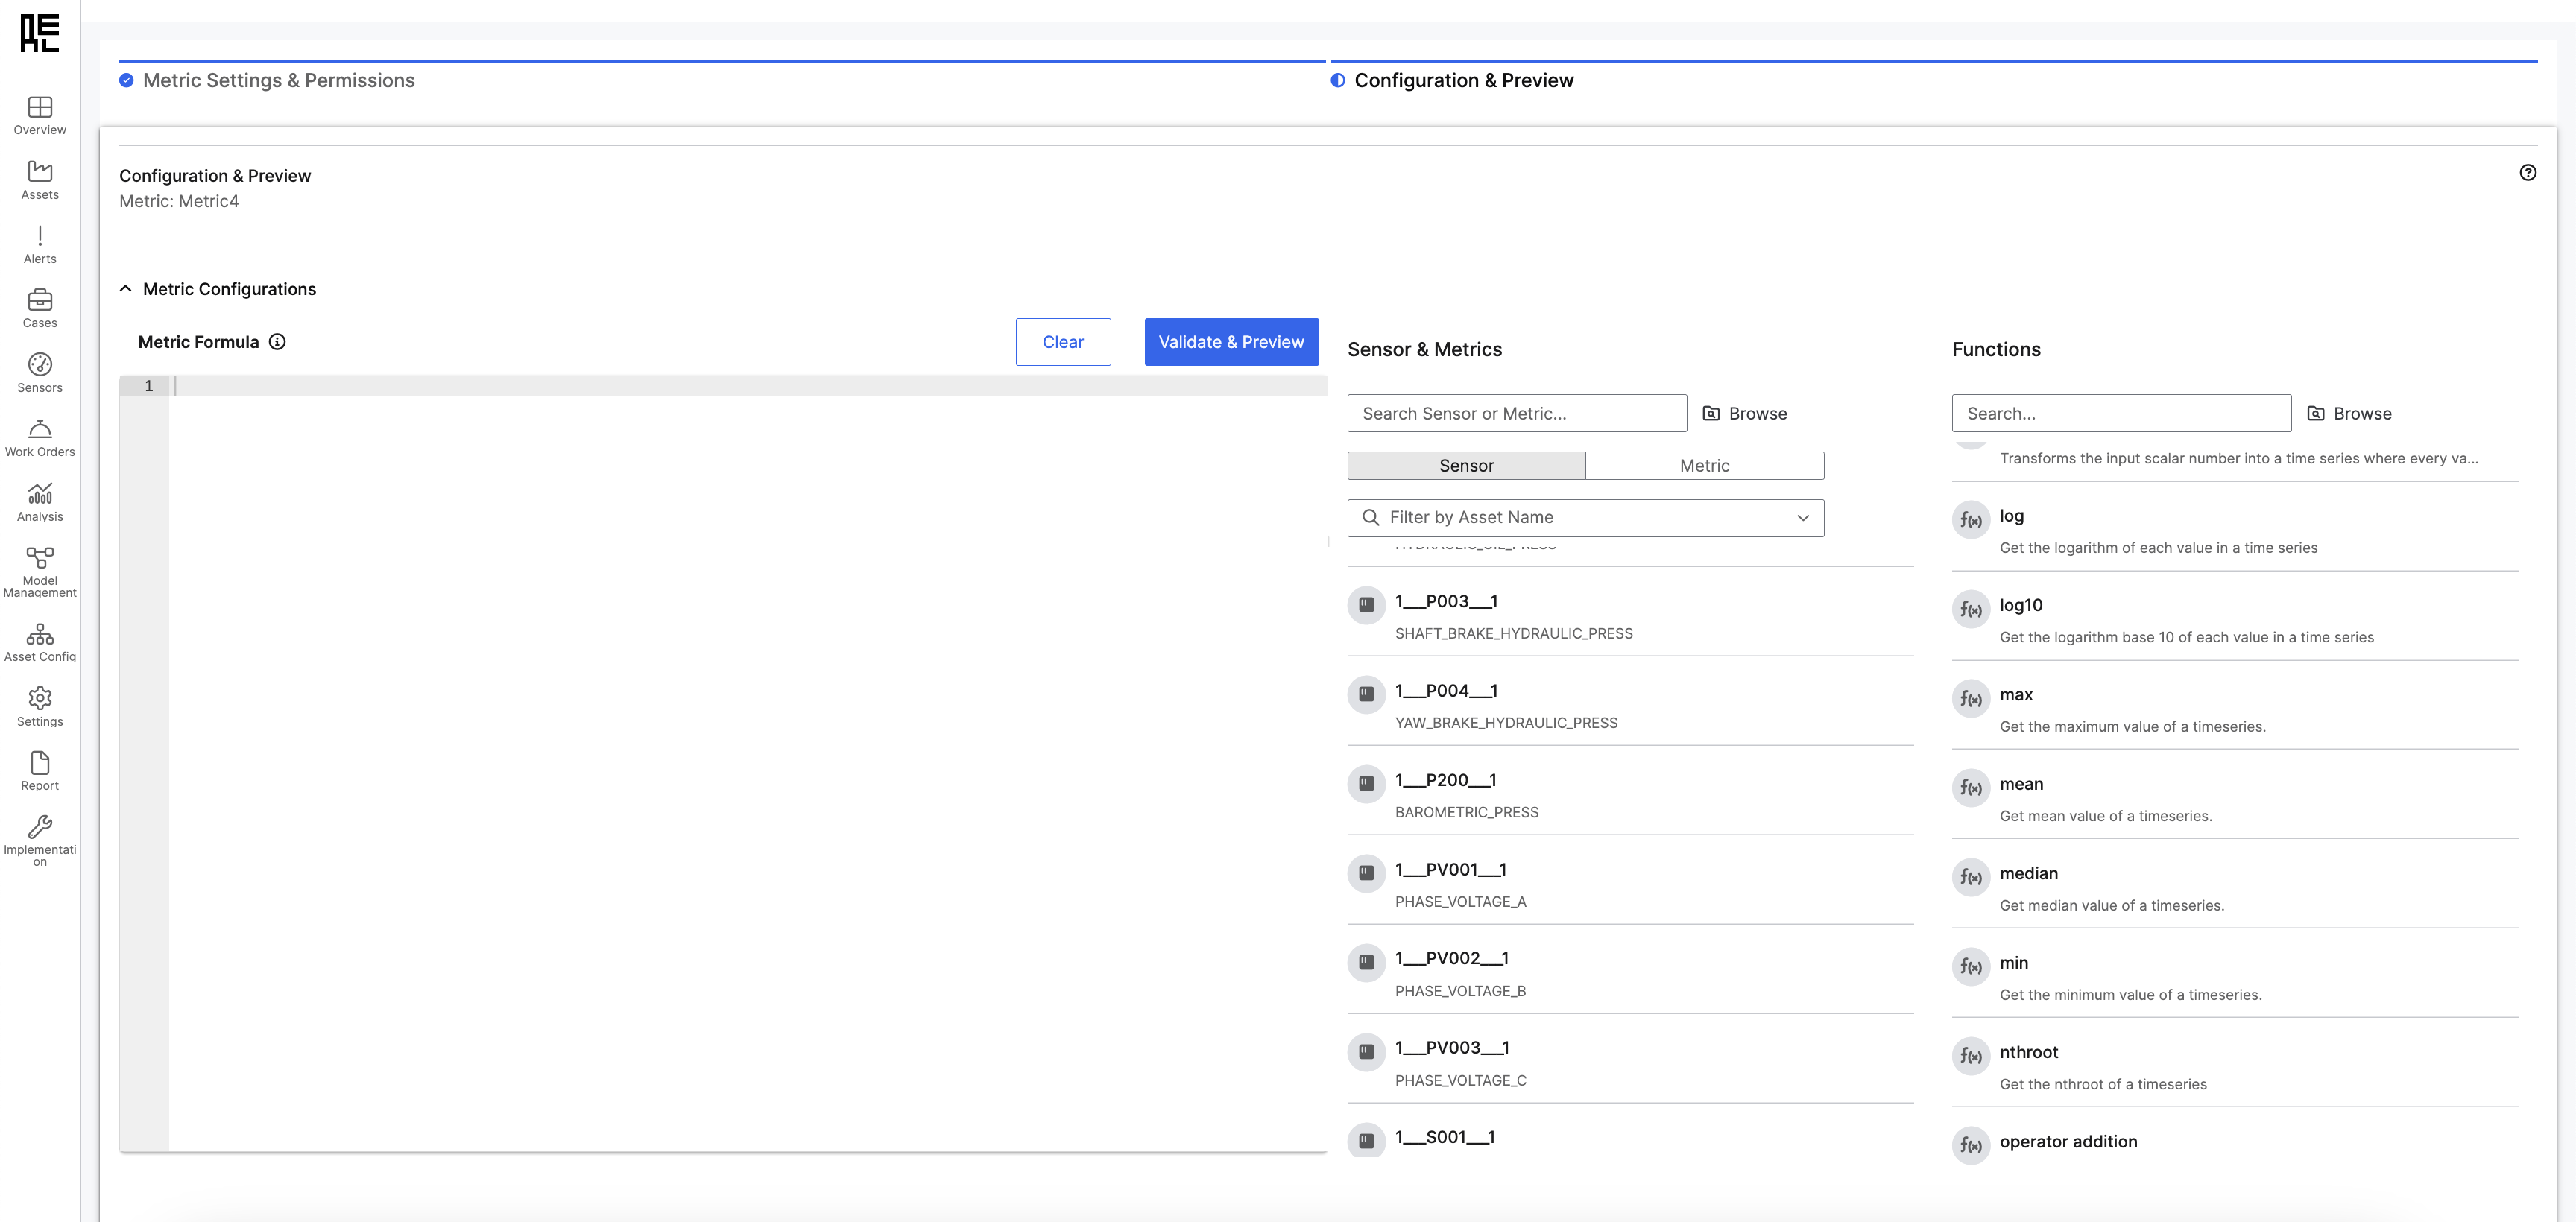 This section allows users to define their metric formula using sensors, previously created metrics, and built-in functions.
Metric Formula Box
This is where users input or construct their metric formula.
Formulas can include:
This section allows users to define their metric formula using sensors, previously created metrics, and built-in functions.
Metric Formula Box
This is where users input or construct their metric formula.
Formulas can include:
- Sensor IDs, following the format
sensor("sensor_ID"). - Previously created metrics.
- Mathematical functions (for example,
avg(),sum(),min(),max()).
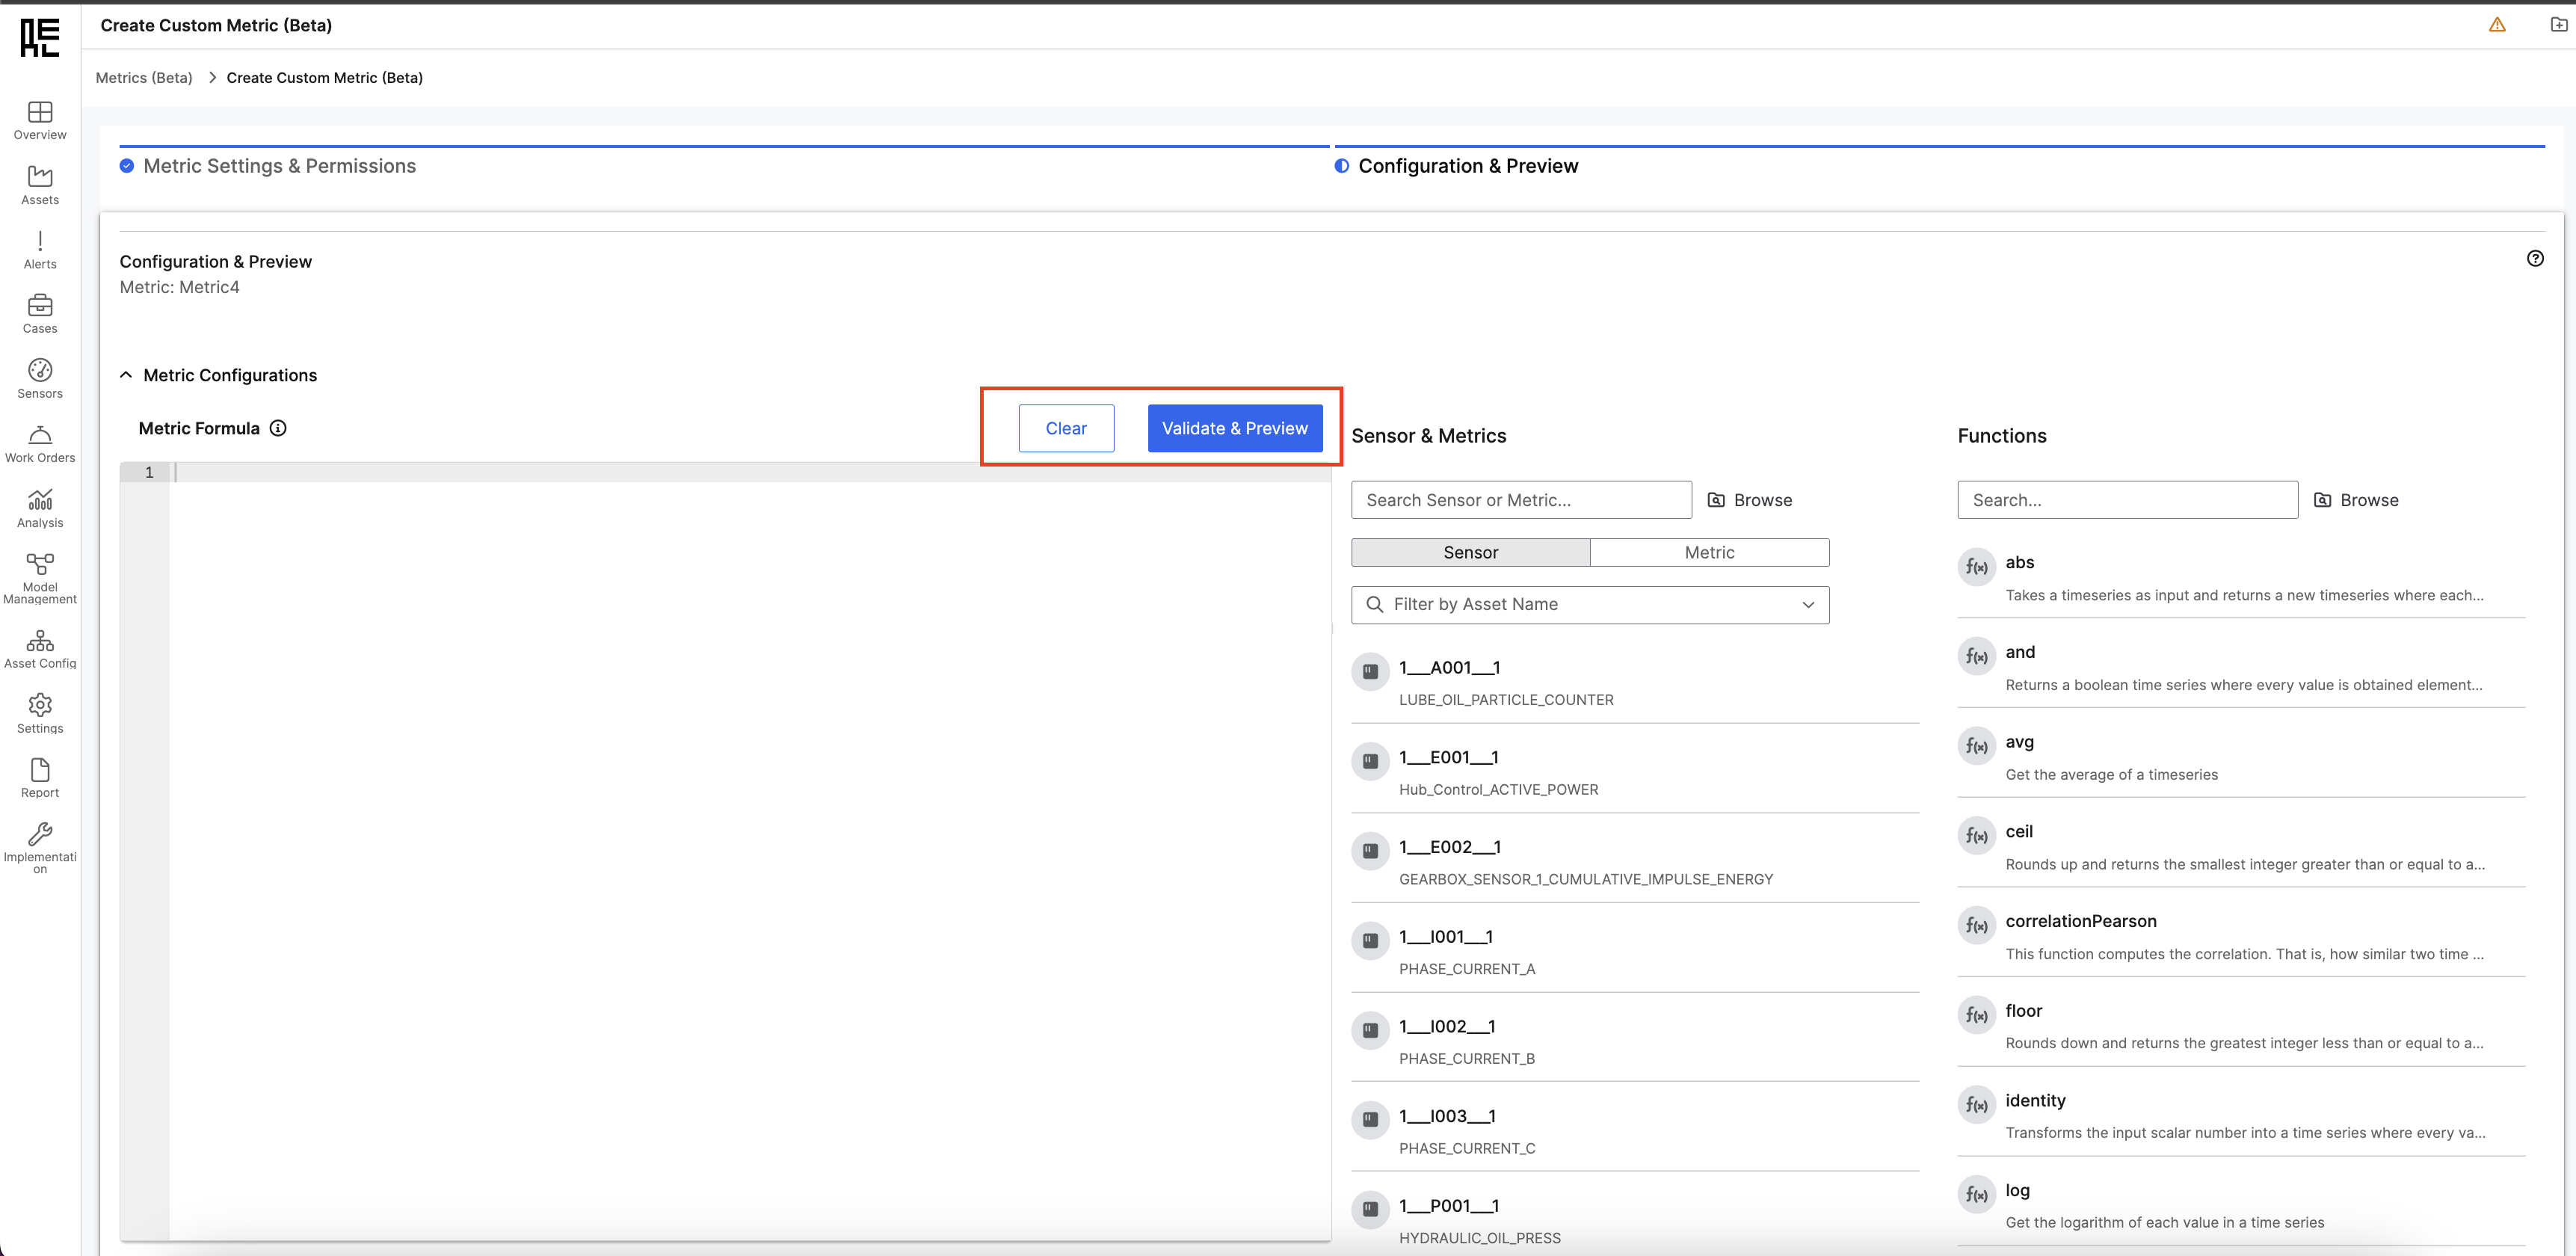
- Select “Validate & Preview” to check if the formula is correctly written.
- Select “Clear” to reset the formula field.
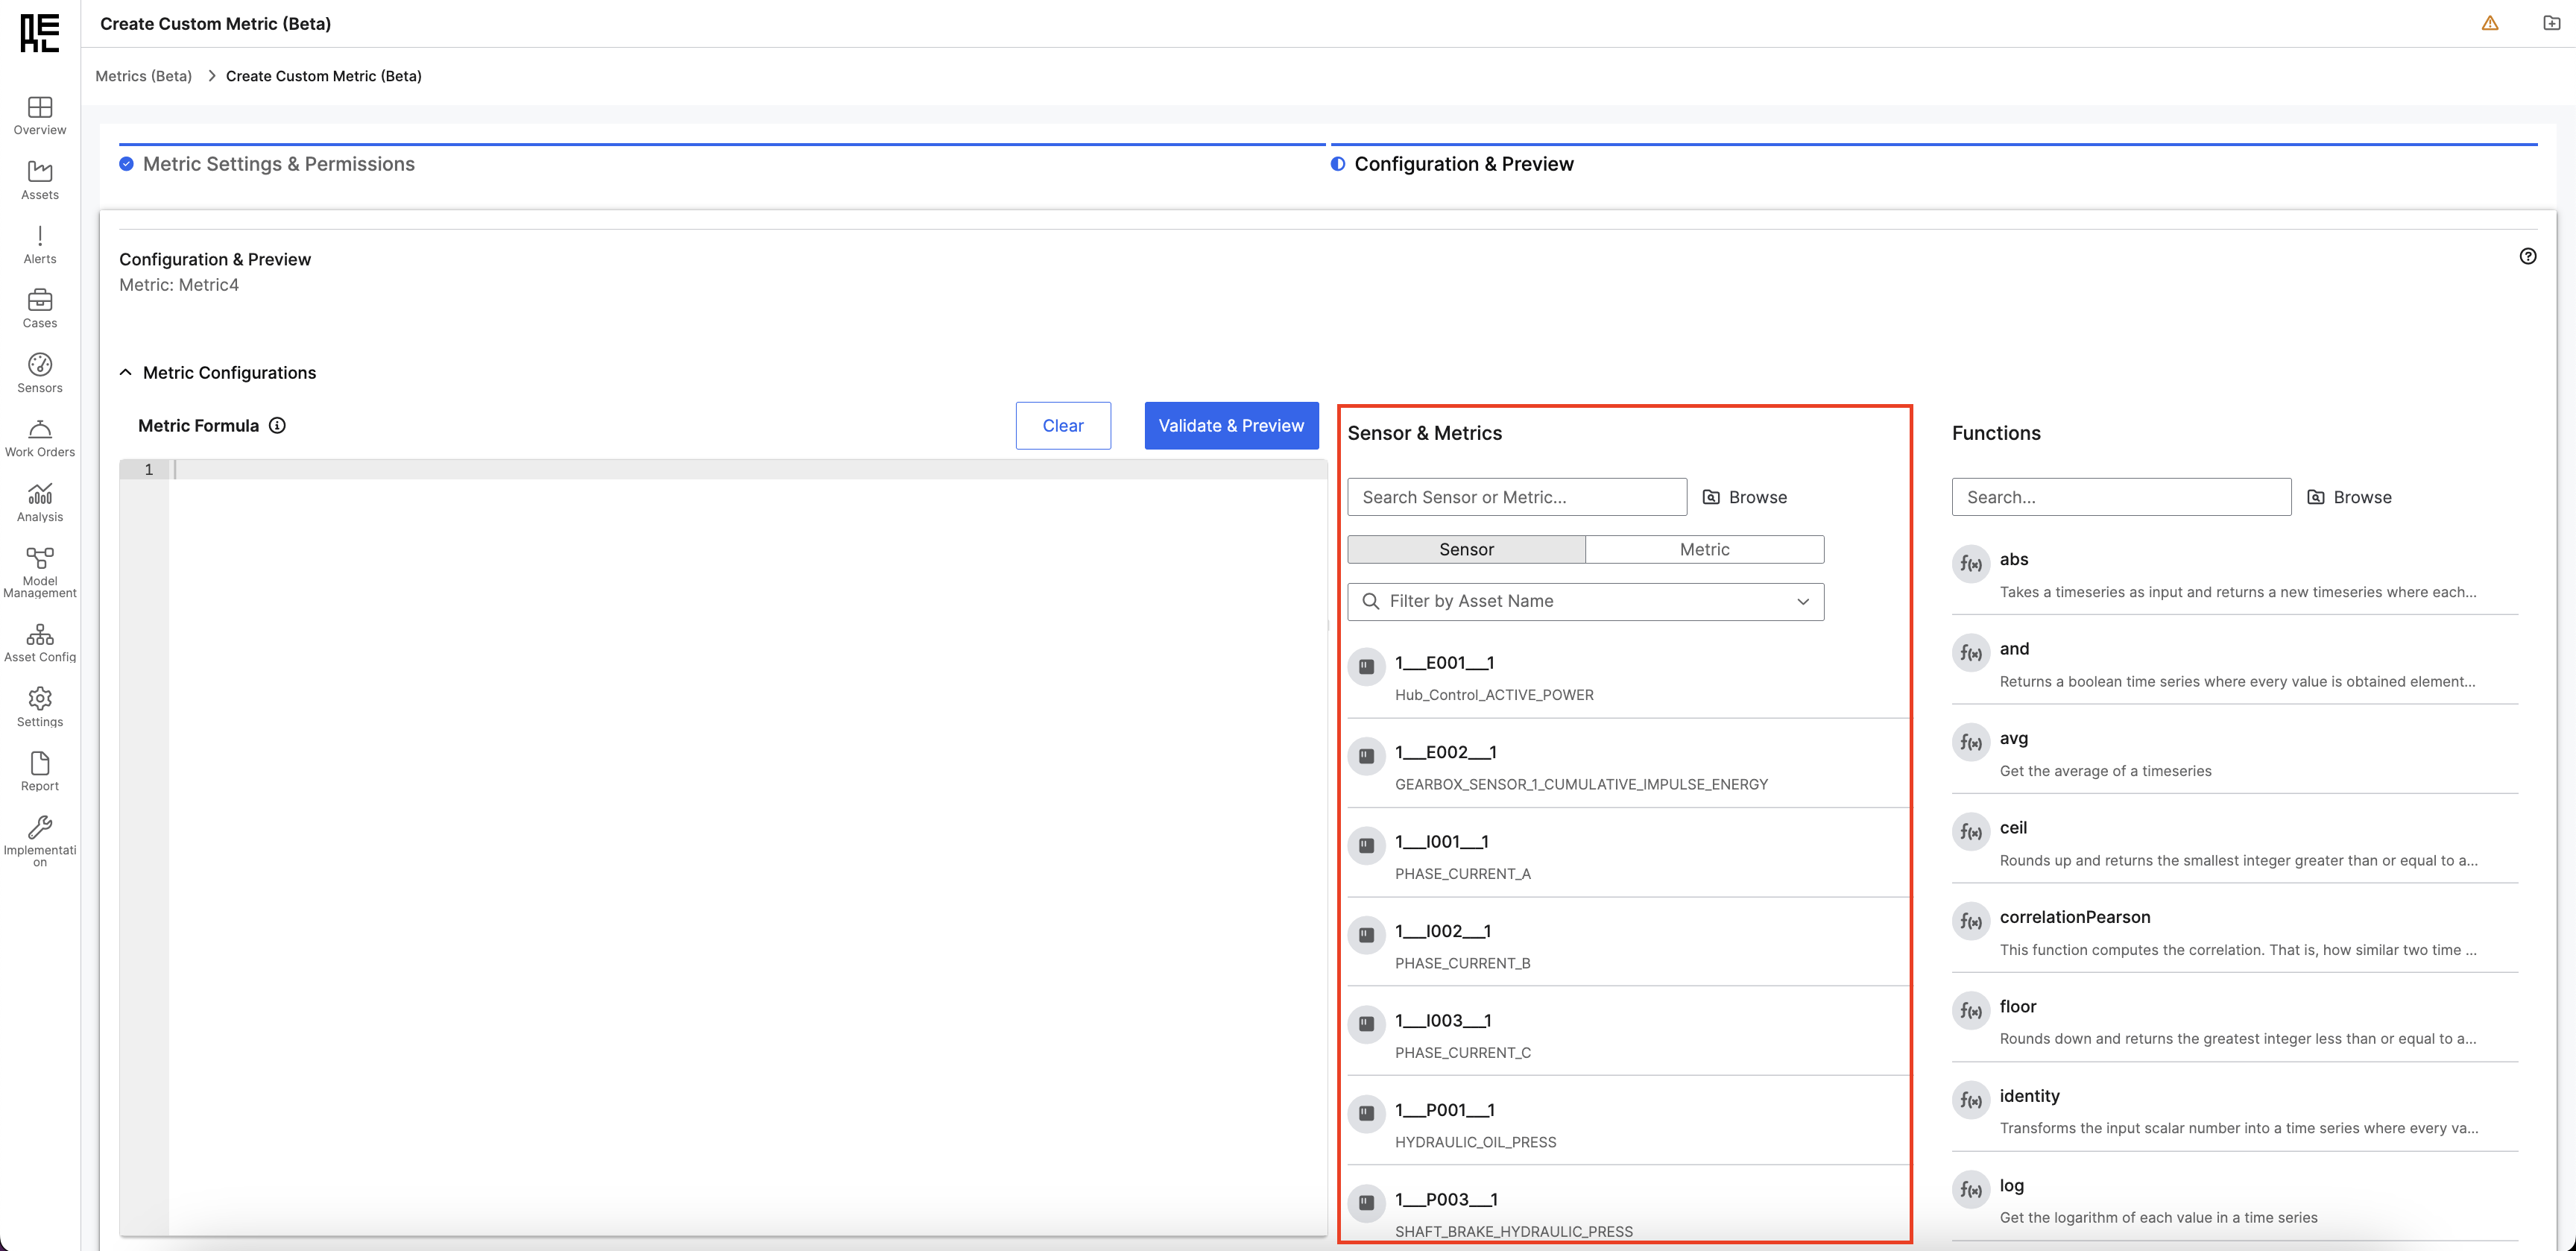
 Sensor & Metrics panel
This panel allows users to search and select sensors and metrics for their formula.
Sensor & Metrics panel
This panel allows users to search and select sensors and metrics for their formula.
 How to Use This Panel
- Users can toggle between the sensor list and the metrics list.
- Use the “Filter by Asset Name” option to refine the selection.
- Note: The sensor or metric will be added to the end of the formula by default, but the user can manually reposition it afterward
- Users can also search for sensors or metrics by clicking the “Browse” folder icon.
- The sensors and metrics shown in this section will depend on the selected facility in the Metric Settings and Permission section.
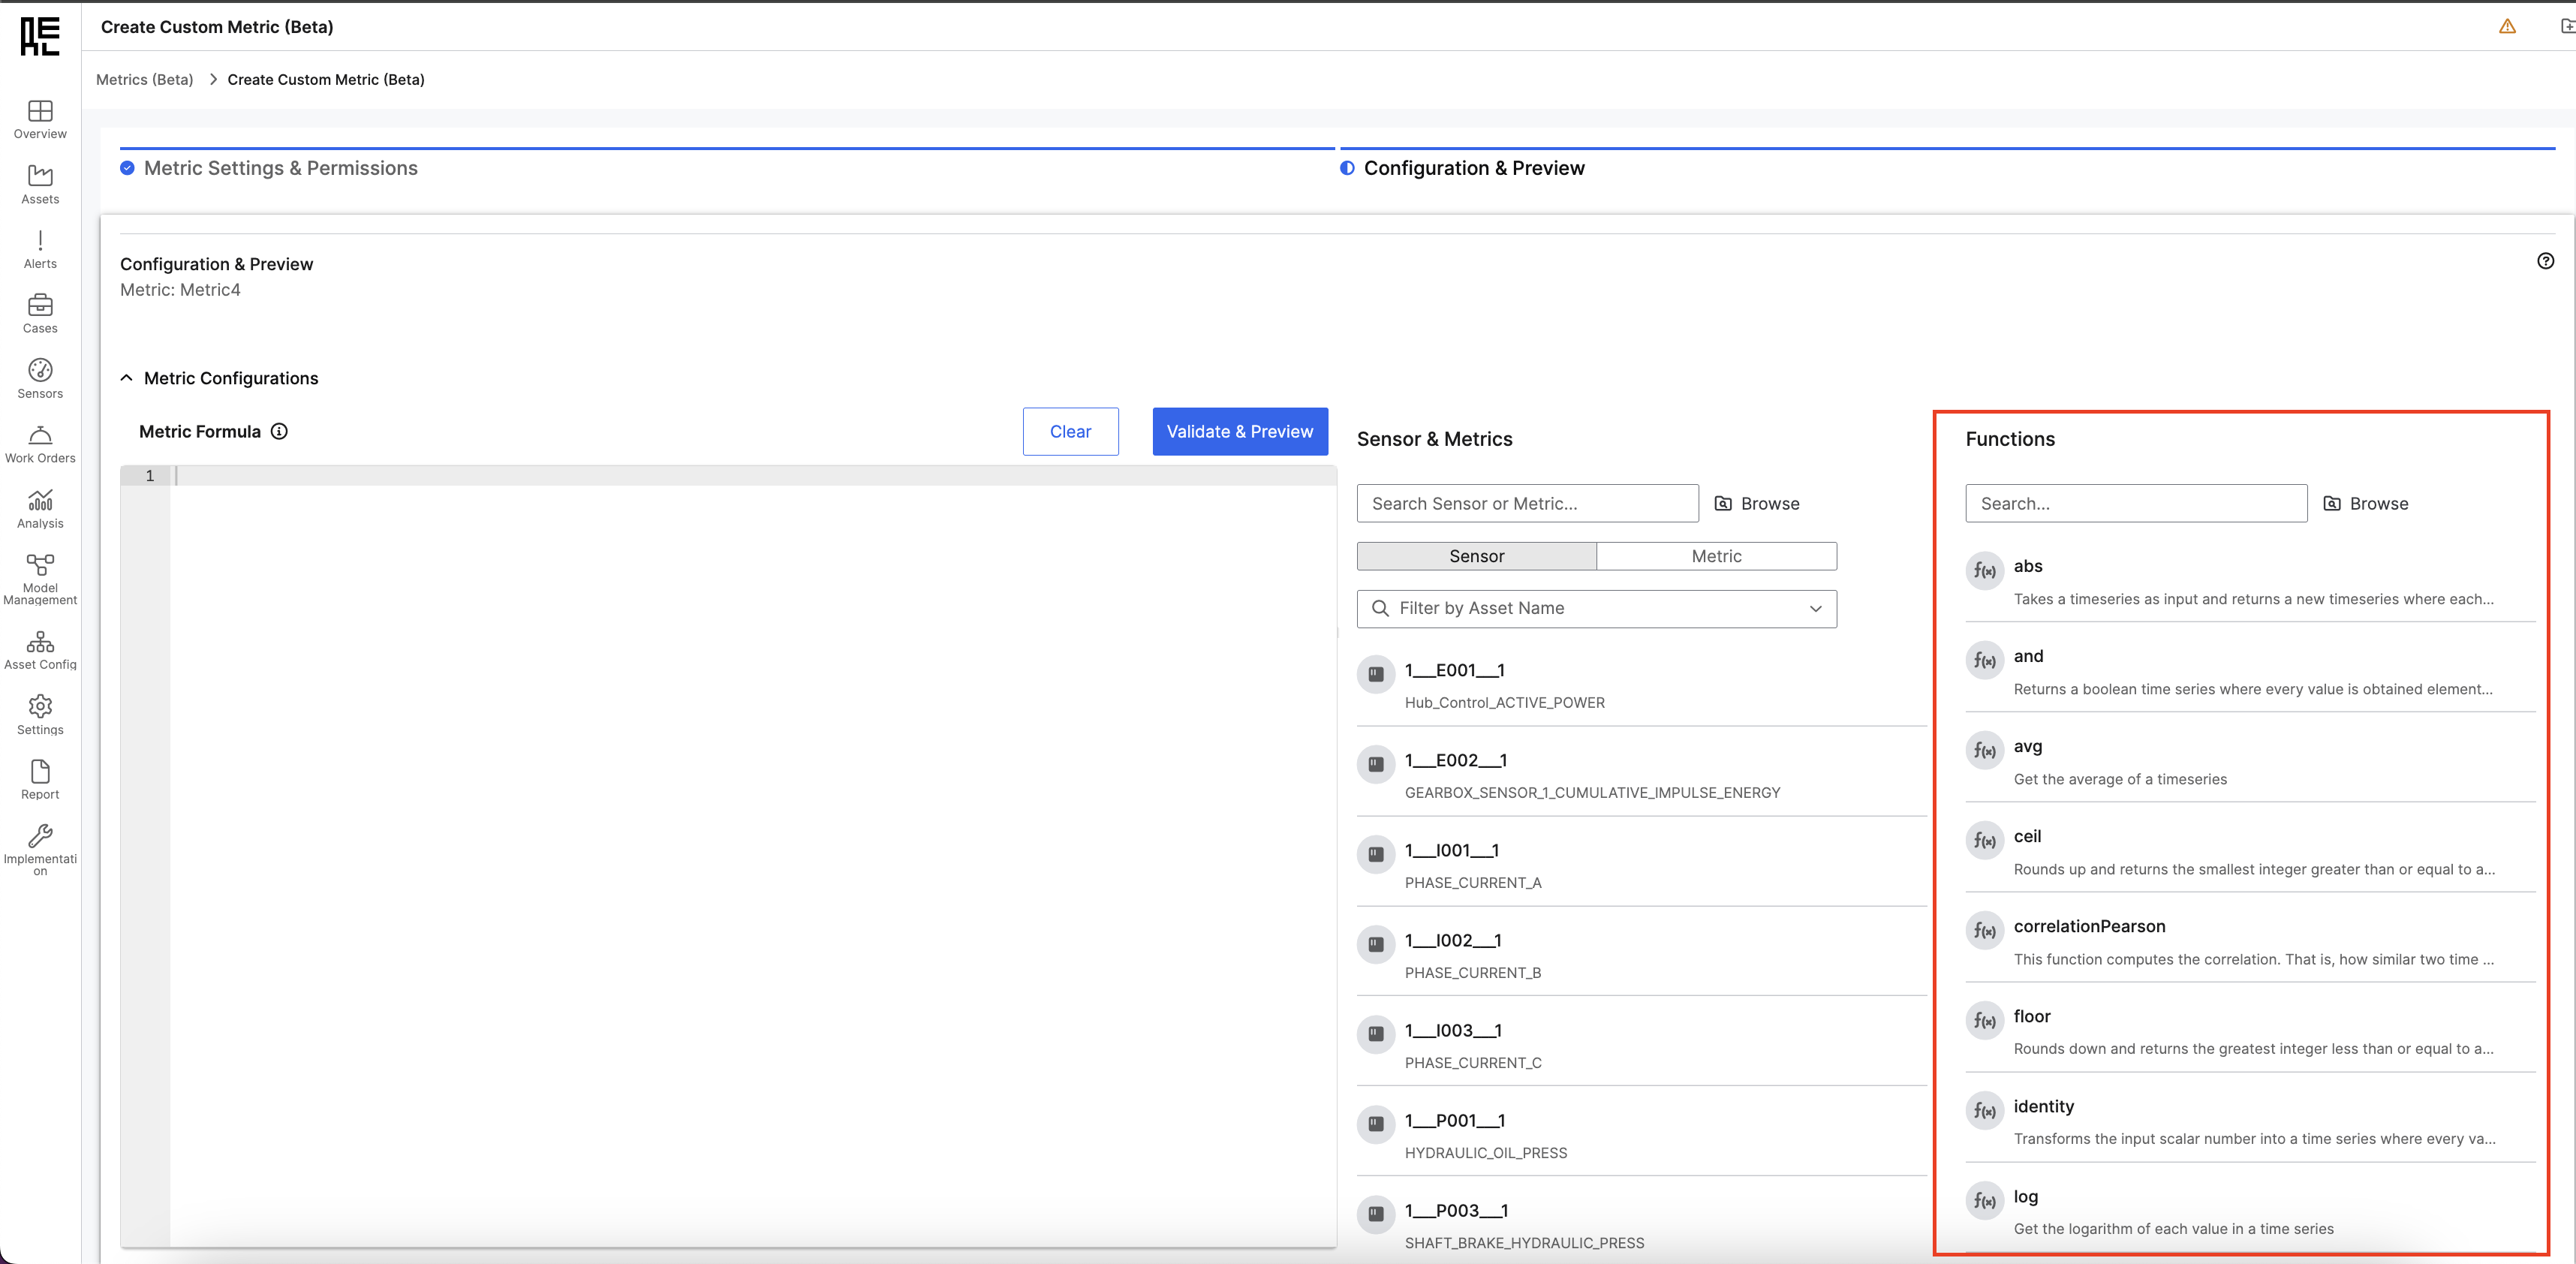 How to use this panel
- Use the “Search” section to look for a specific function.
- Click on a function to insert its base expression into the formula box. (To make the formula valid, you must manually update the sensor ID within the base expression).
sensor("1___I001___1") + sensor("1___I002___1")
Example 2: Creating an Average Formula
avg(sensor("1___I001___1"), sensor("1___I002___1"))
Validating and Previewing the Formula
- Select “Validate & Preview”: ✅ Success: A green banner confirms validation.
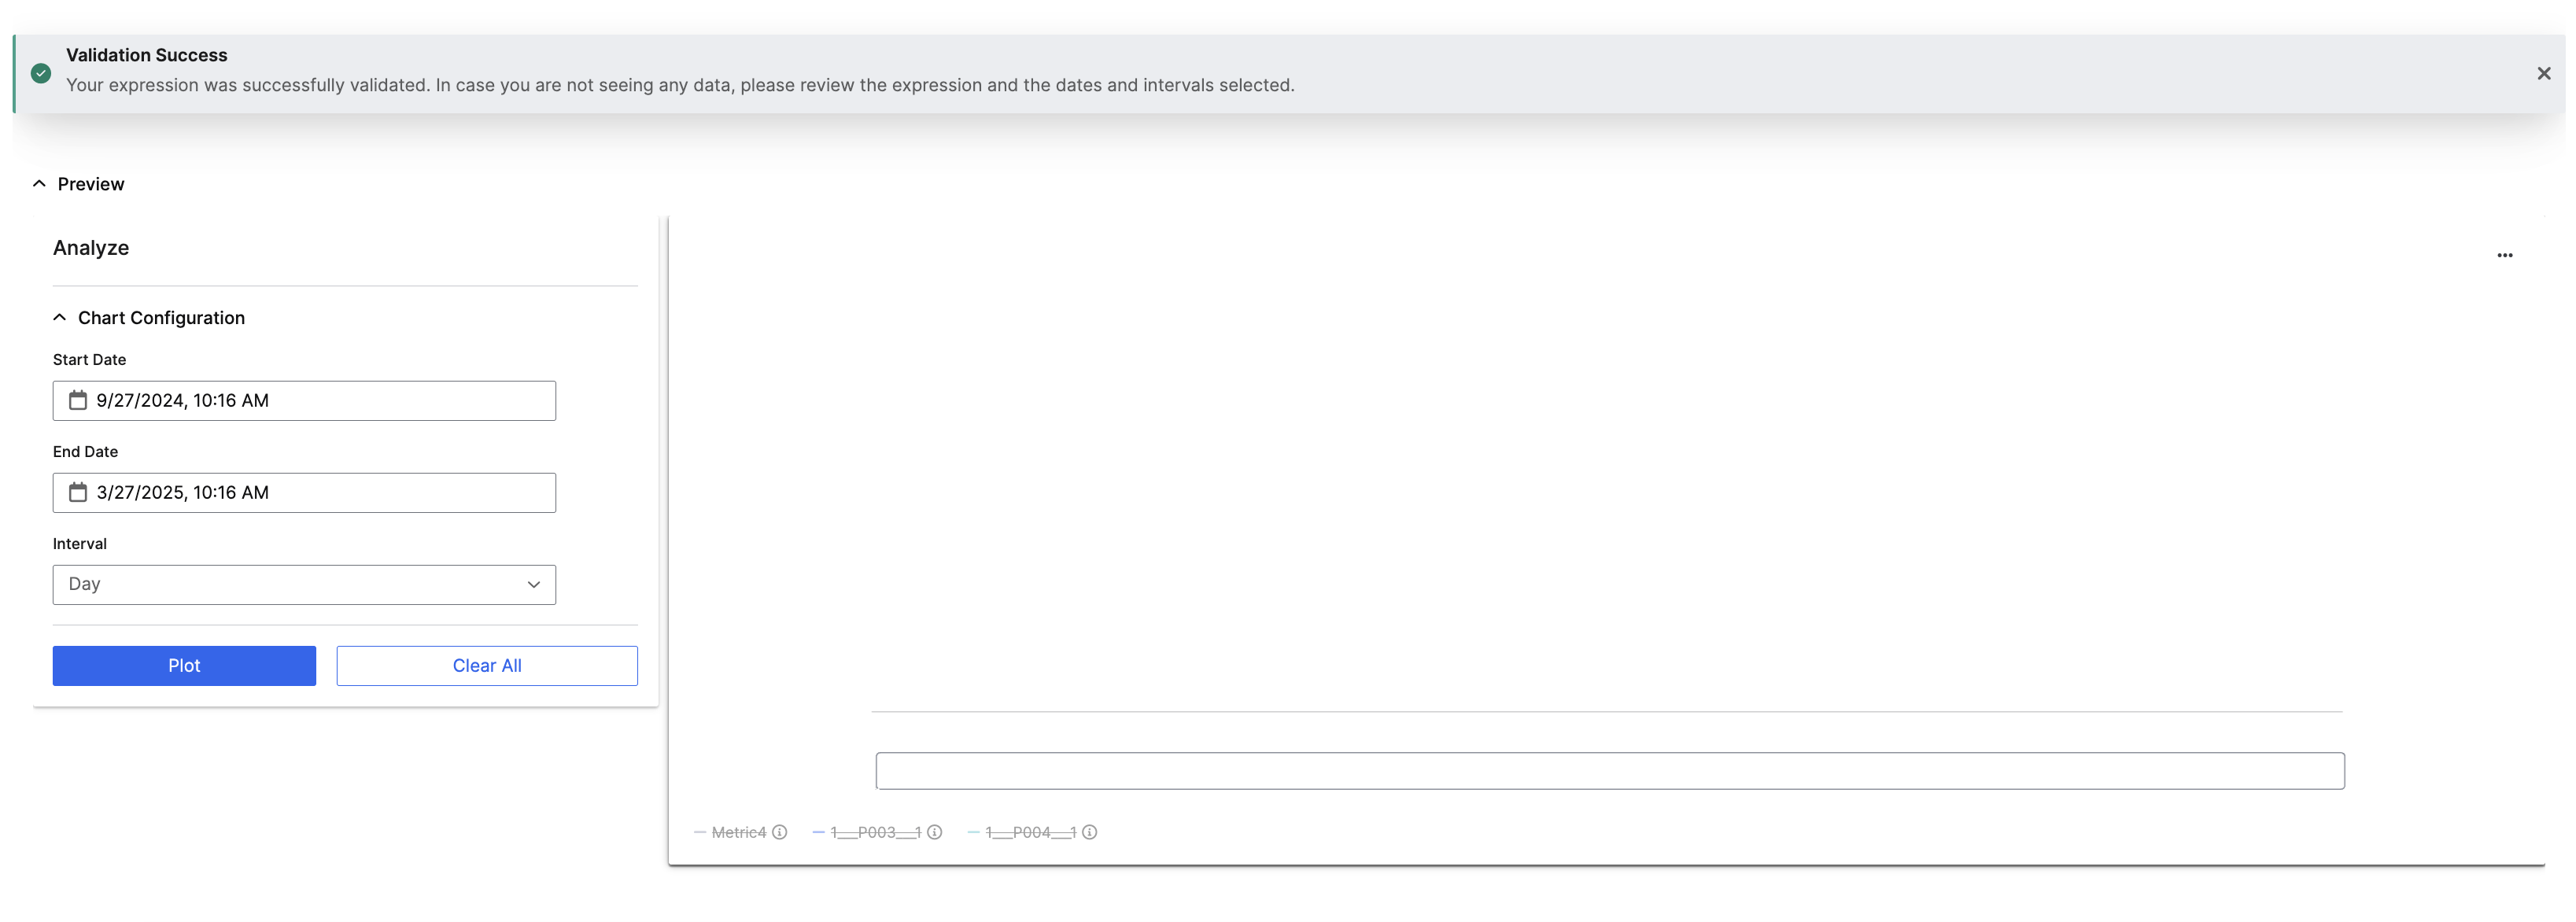 ❌ Error: A red banner explains the issue.
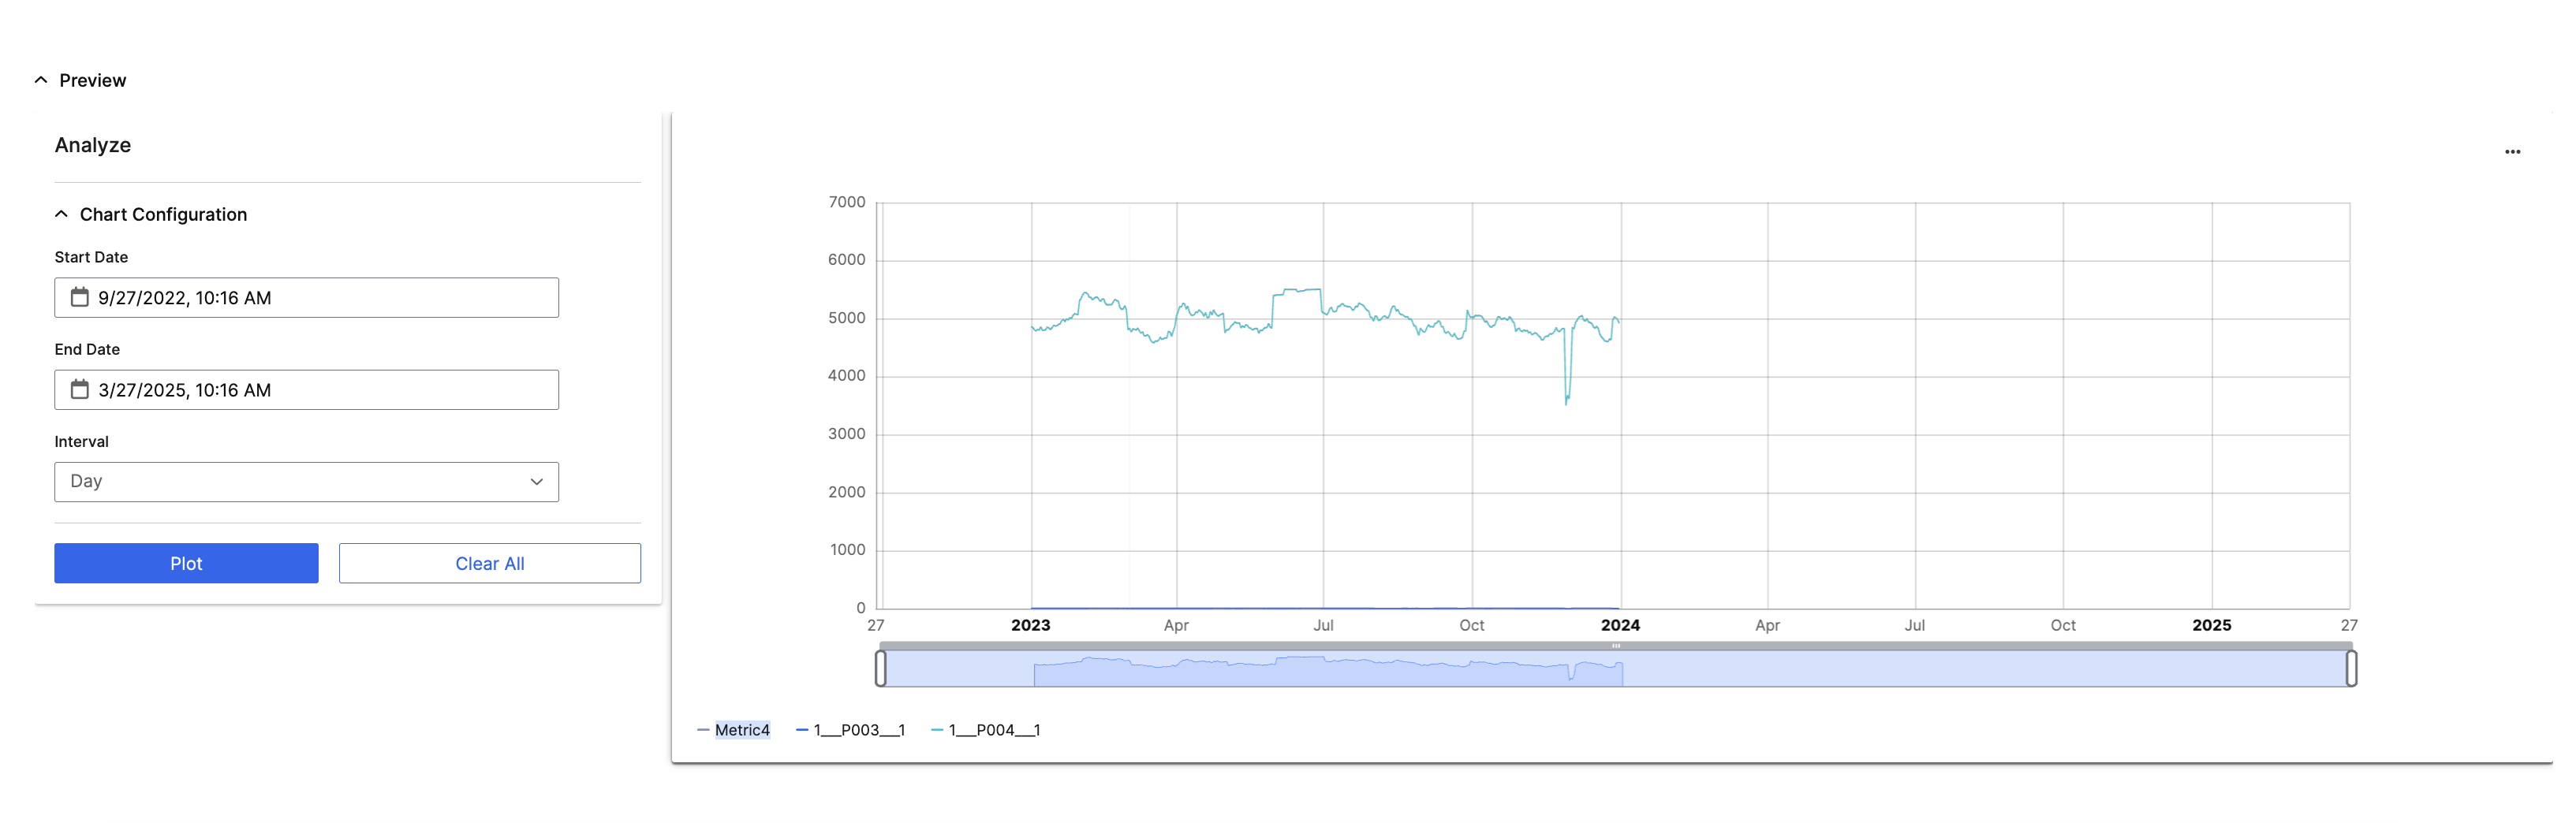
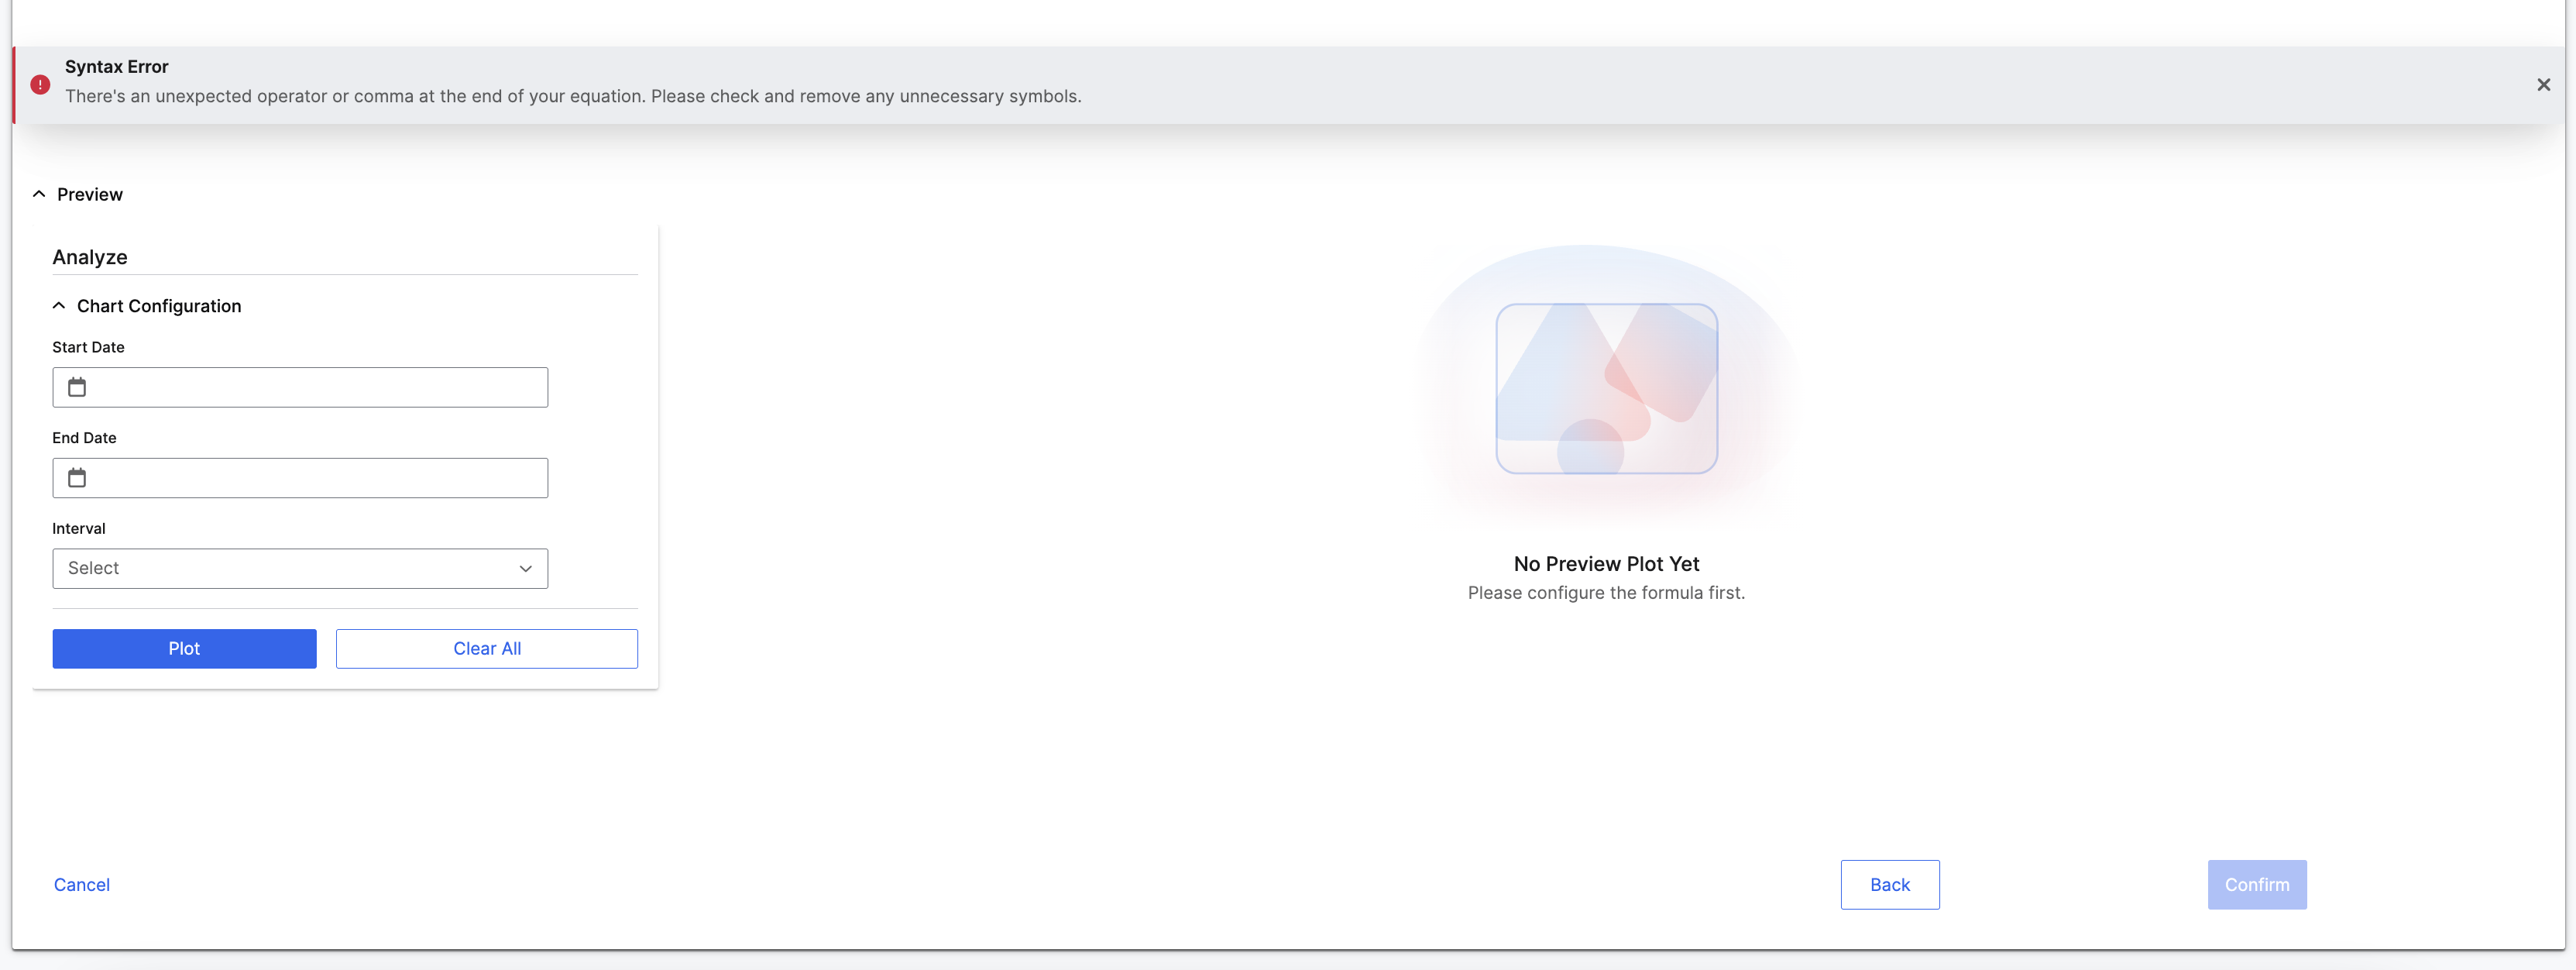 Chart Configuration & Graph Preview
- Users can analyze metric output using historical data.
- Default time range: Last 6 months (users can adjust).
- Select “Plot” to generate a preview graph.
- Select “Back” to return to Metric Settings & Permissions.
- Select “Confirm” to save the metric after validation and previewing.
- Select “Cancel” to exit without saving.
Review and Confirm
Once the user clicks “Confirm,” a Review & Confirm pop-up appears to finalize details.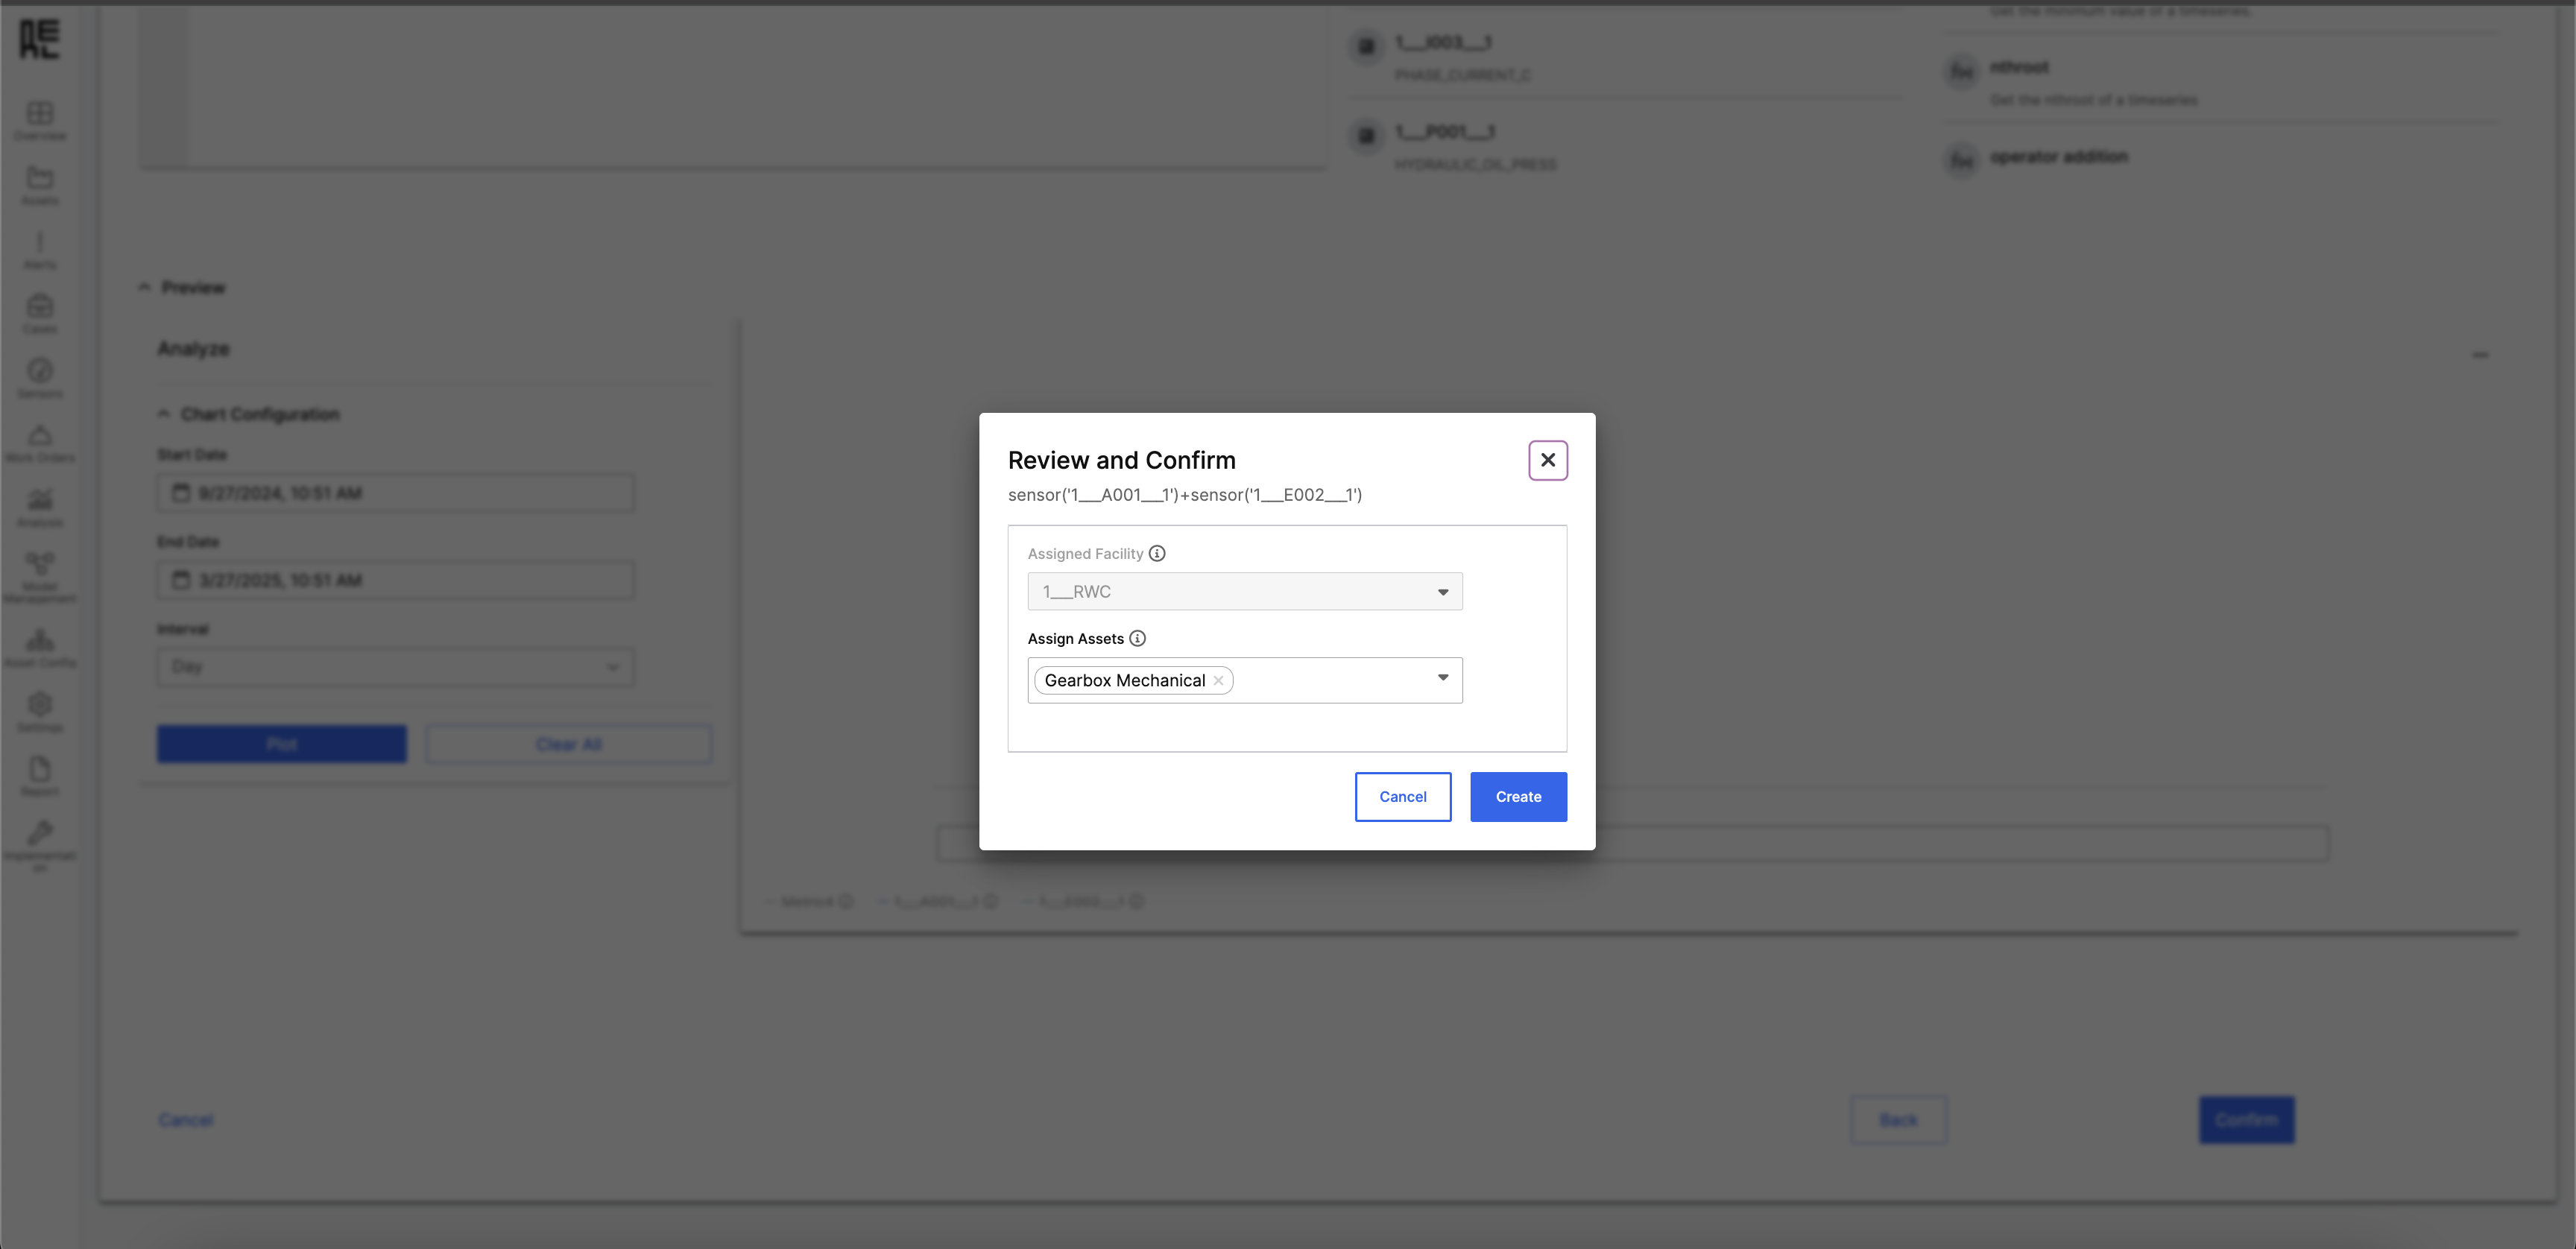 Review Metric Formula
The metric formula is displayed for verification.
Assigning Facility and Assets
Review Metric Formula
The metric formula is displayed for verification.
Assigning Facility and Assets
- Facility is pre-populated based on the initial metric definition.
- Assets are pre-populated depending on the dependent metrics or sensors selected.
- Users can adjust by adding/removing assets.
Finalize the Metric
- Select “Cancel” to go back.
- Select “Create” to finalize and add the metric to the Metric Library.
Edit/Delete Metric
Only the user who created the metric and set its permission to “For Me Only” can edit or delete it. To edit or delete a metric:- Go to the Metric Library page
- Click the view icon next to the metric you want to manage
- A detail side panel will open, displaying the metric’s configuration and metadata.
- At the bottom of the panel, click Edit to modify the metric or Delete to remove it.
Edit
When the user clicks Edit, they’re redirected to the “Create Metric” page. This time, all fields are pre-populated with the data from the metric being edited.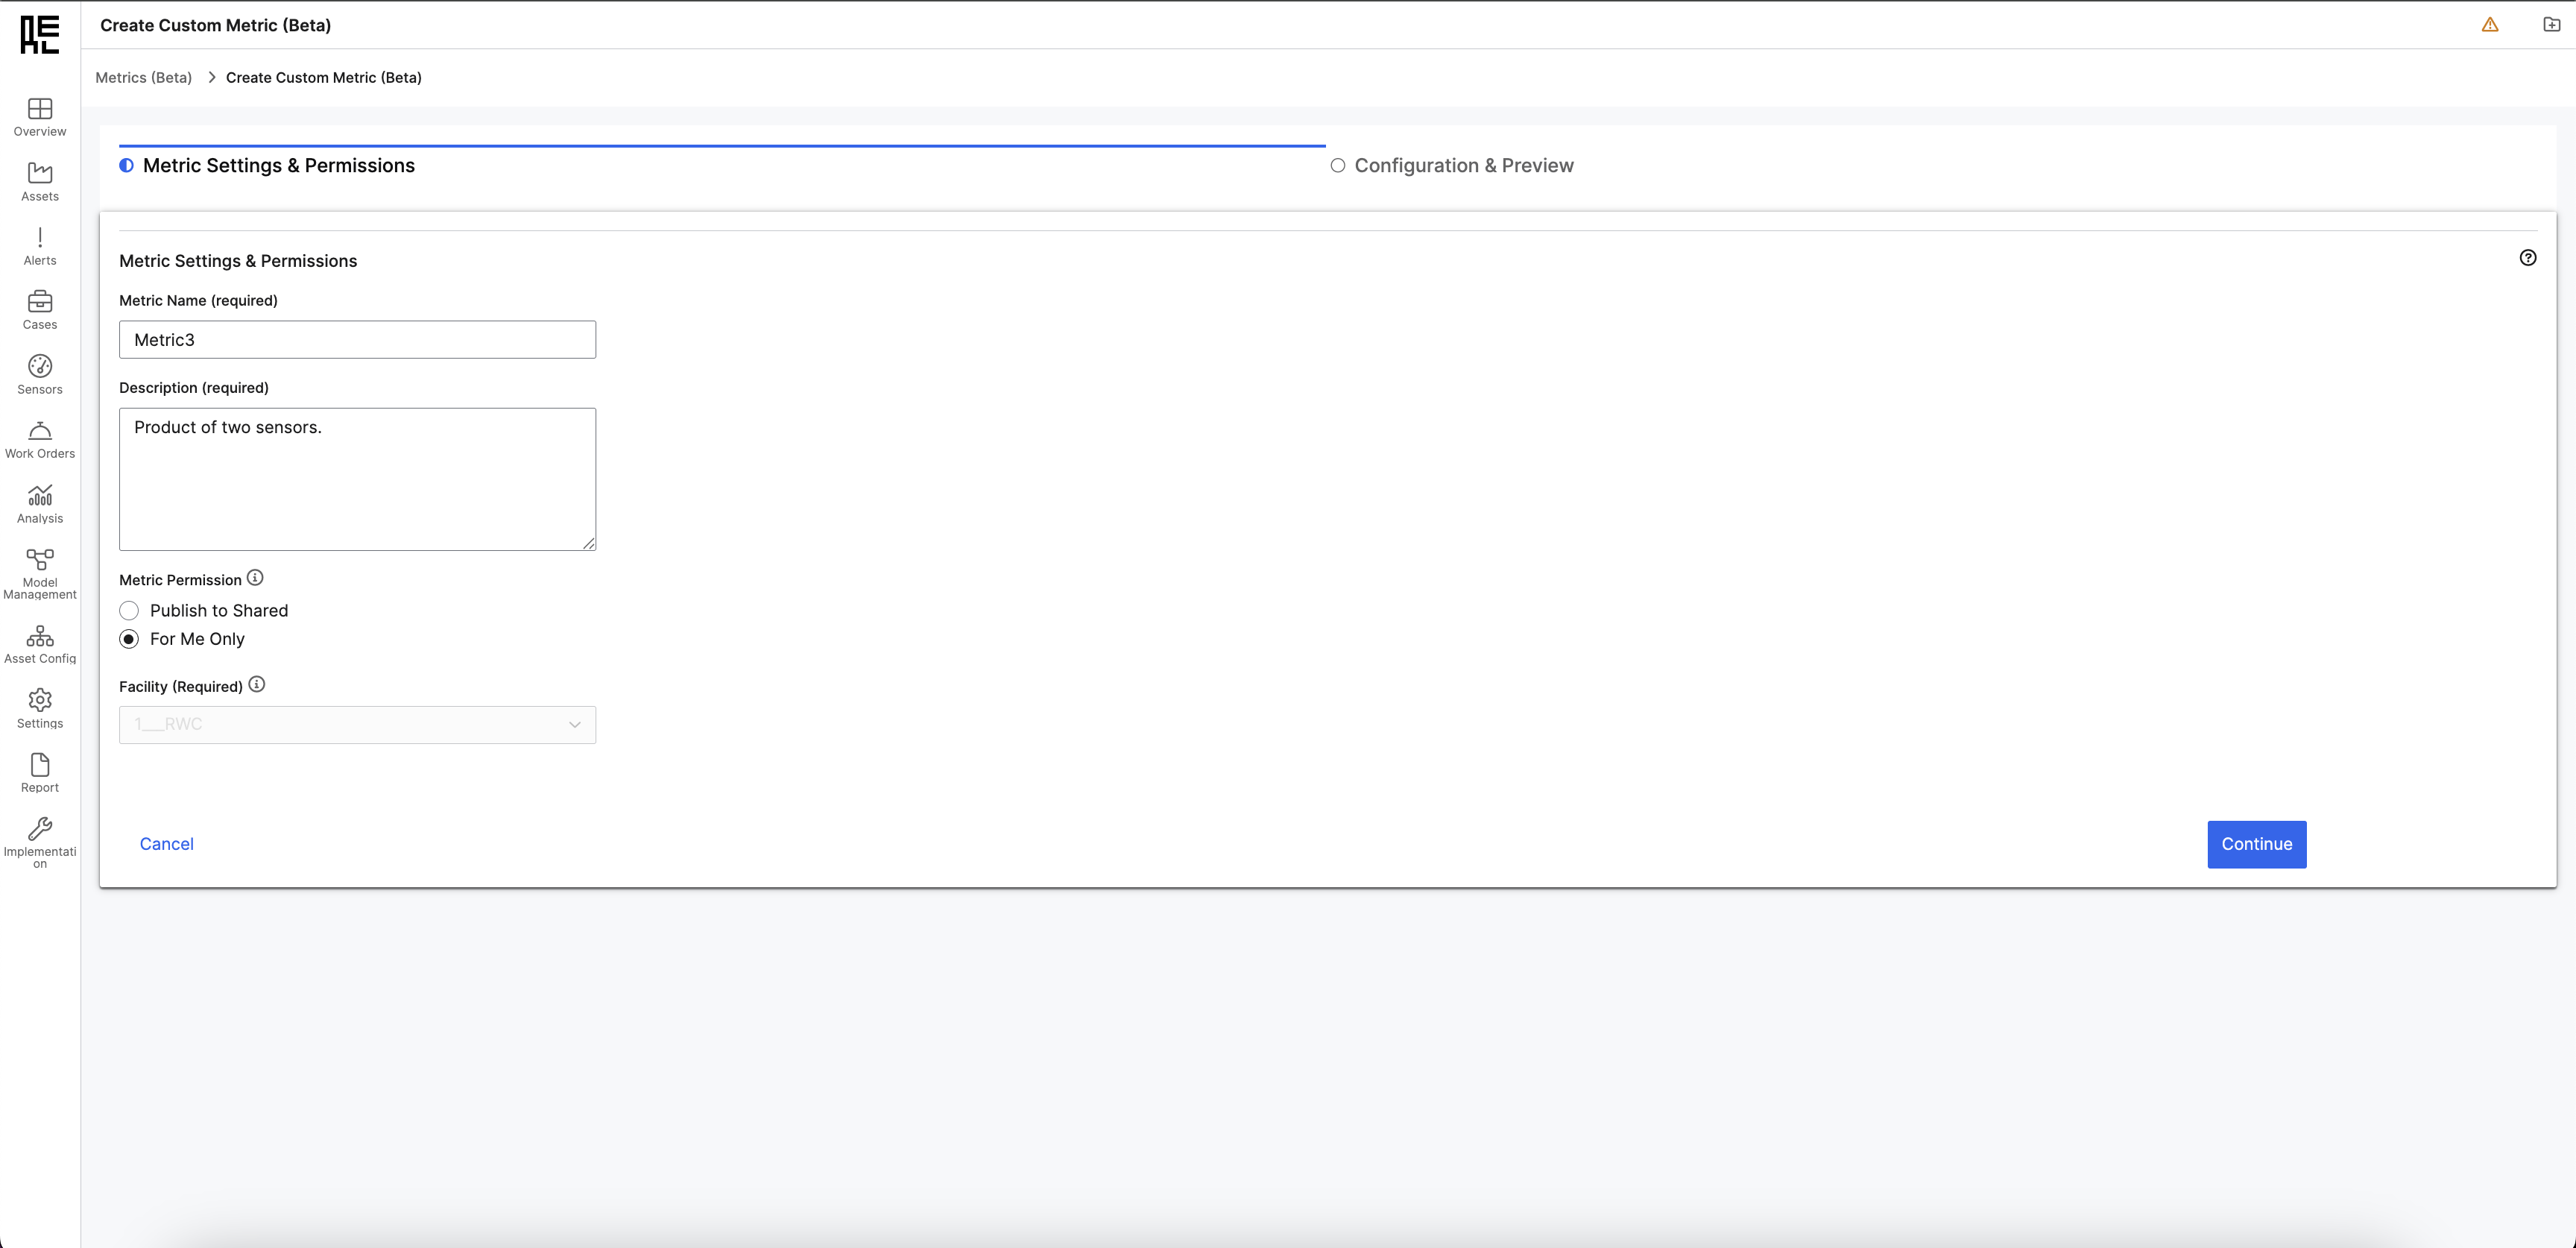
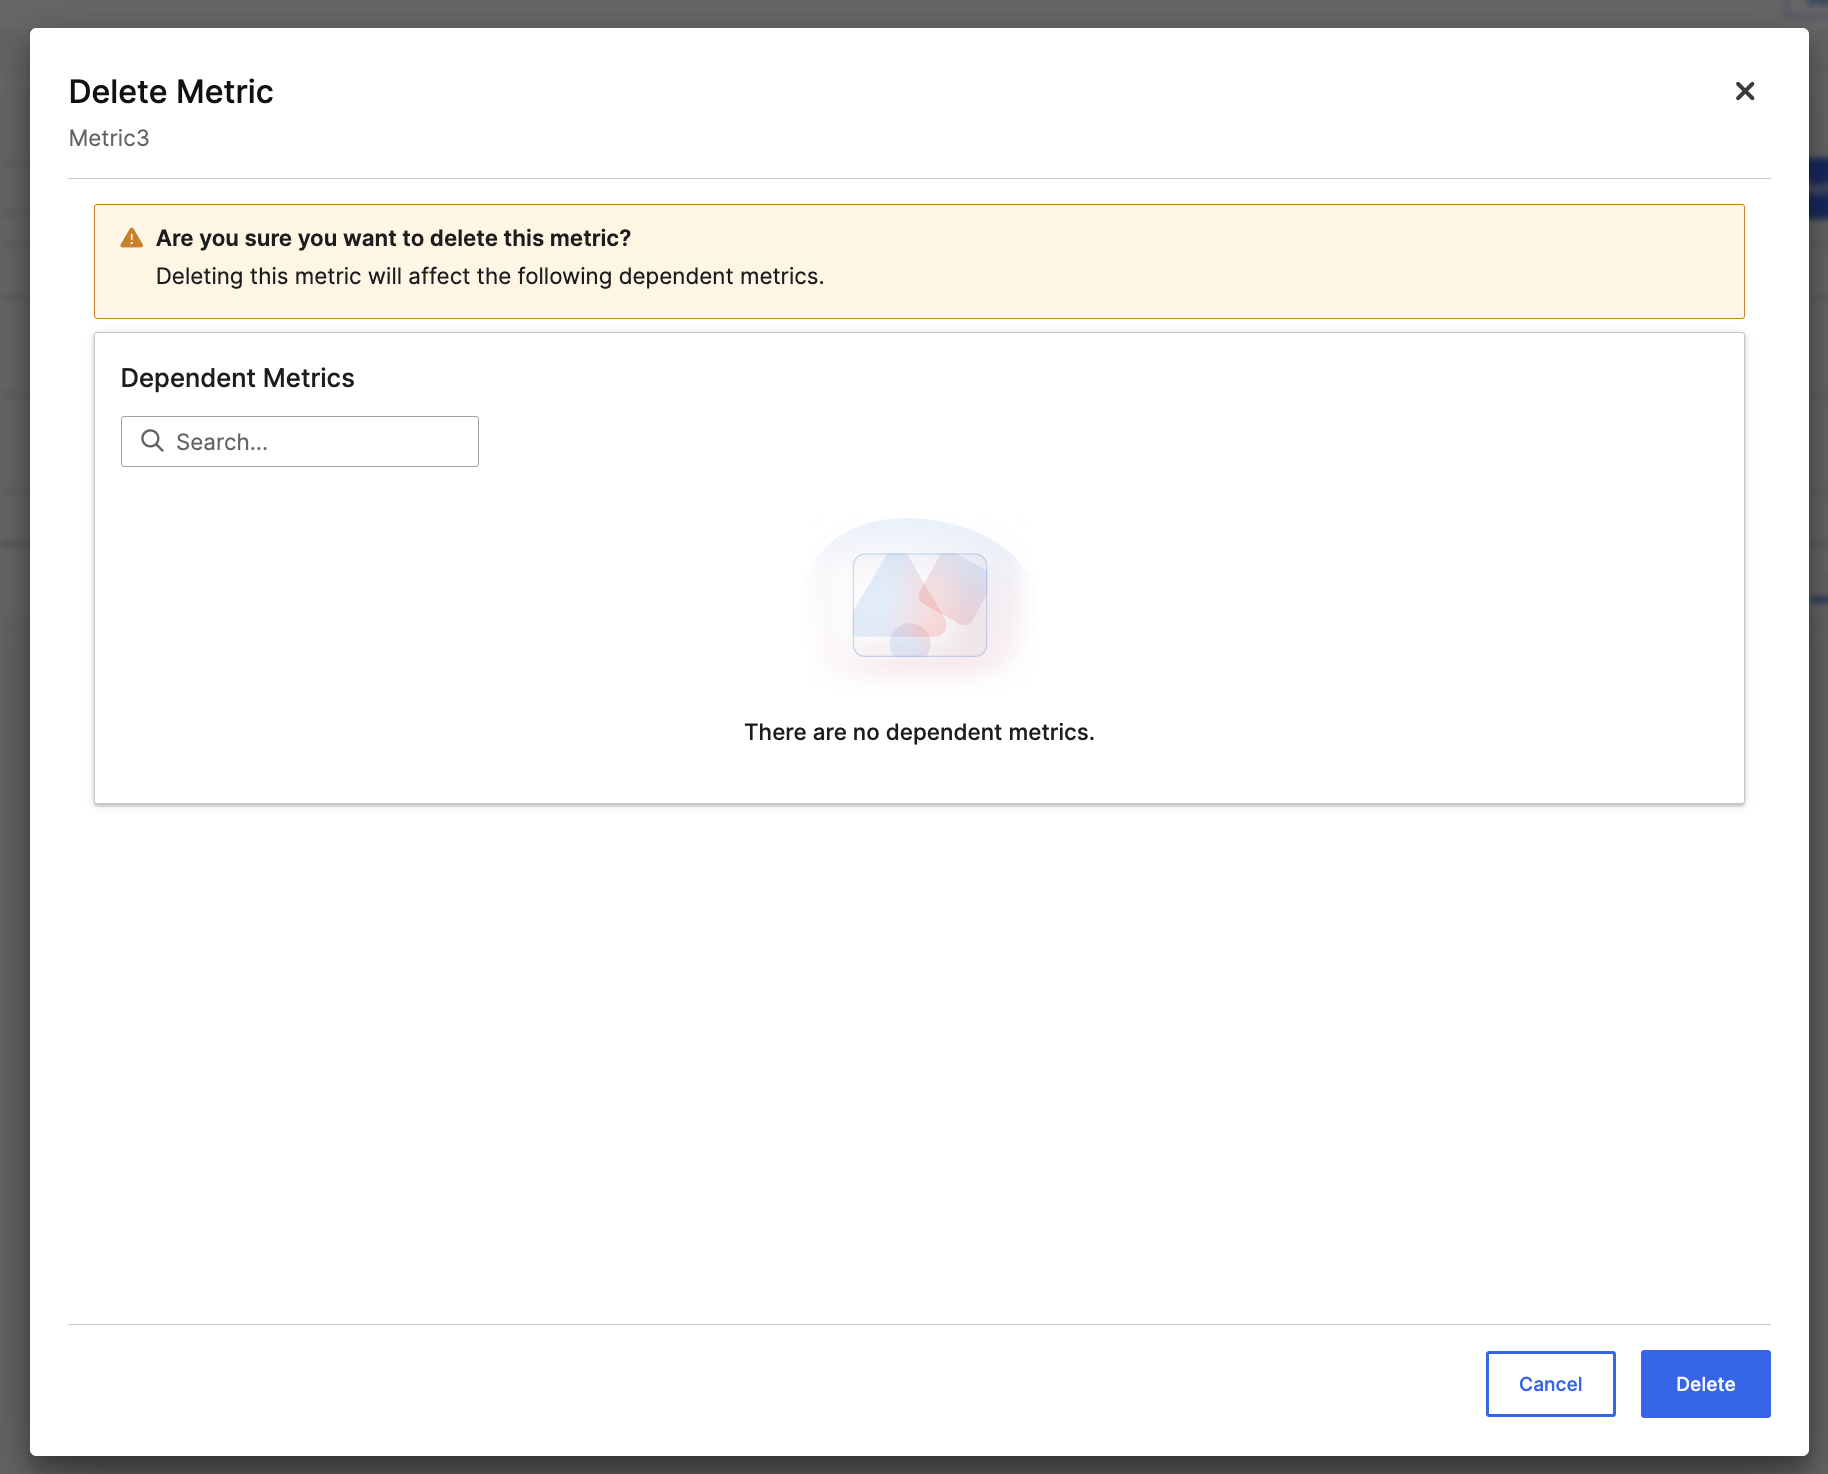
Delete
When the user clicks Delete, a confirmation modal appears prompting them to confirm the action. The modal also displays any dependent metrics—metrics that rely on the one being deleted. If there are no dependent metrics, the modal will clearly indicate that.- Click Delete to confirm and proceed.
- Click Cancel to exit without deleting.
Using Your Metric in Time Series Analysis
Once the metric is created, users can plot it in the Time Series Chart alongside other sensors and metrics in the Analysis section. To do this:- Navigate to “Analysis” from the left-hand navigation panel.
- Select “Time Series.”
- In the Plot feature filter, specify the metrics to plot.
 This process enables users to visualize trends and perform historical analysis by plotting metrics, sensors, features, and alerts.