The Alert Details Page appears when you click on anDocumentation Index
Fetch the complete documentation index at: https://devdocs-shaunak-branch.mintlify.app/llms.txt
Use this file to discover all available pages before exploring further.
Alert Name from various locations in the application.
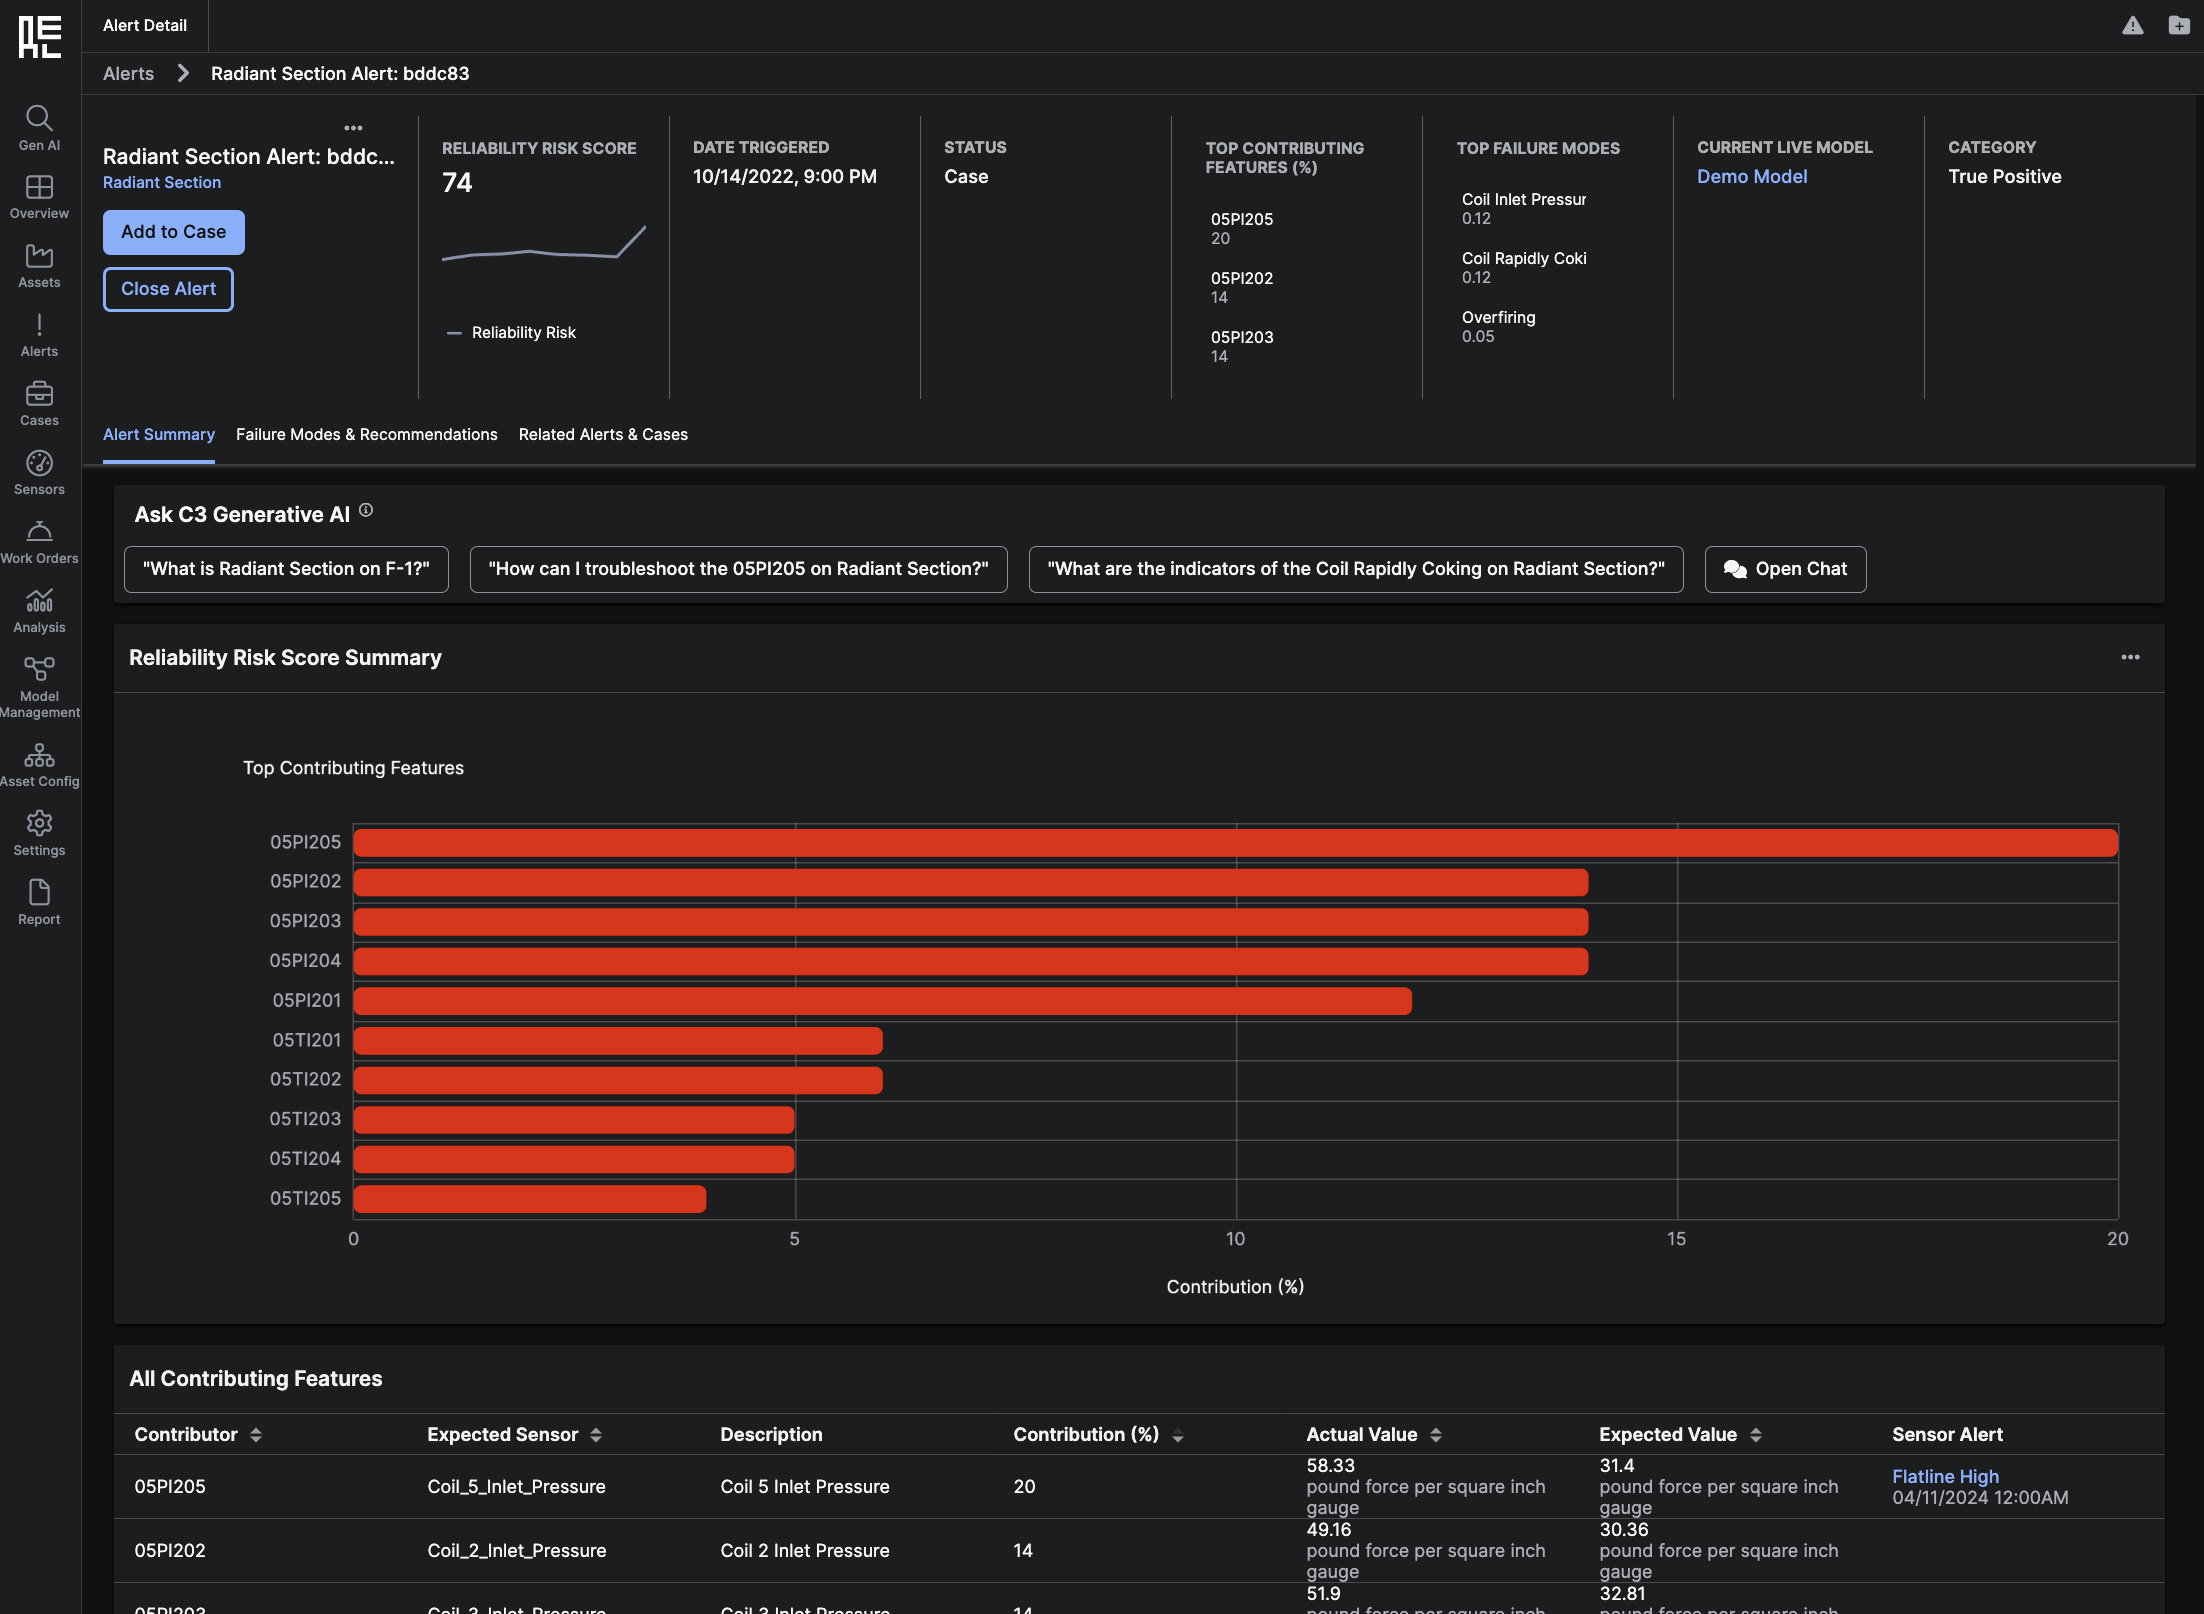 The summary information for the specific
 Alert at the top of the page includes:
- Reliability Risk Score
- Date Triggered
- Alert Status
- Top Contributing Features (%)
- Top Failure Modes
- Current Live Mode - redirects to Model Details Page
- Category
Alert.
The tab headings include:
- Alert Summary
- Failure Mode & Recommendations
- Related Alerts & Cases
Alert Summary Tab
The Alert Summary tab is open by default when you click on anAlert within a list or grid. This tab contains a page of Alert information that is separated into the following sections:
- Ask C3 Generative AI
- Reliability Risk Score Summary
- All Contributing Features
- Top Failure Modes
- Open Sensor Alerts
- Configurable Timeseries Charts of Reliability Risk Score, Sensor Values, and Scaled Reconstruction Residual
Ask C3 Generative AI
The Ask C3 Generative AI section is the entry point to interact with the C3 Generative AI Chat. This section has several common questions that may help troubleshoot the alert. Clicking on any of the questions or clicking on the “Open Chat” button will open the C3 Generative AI Chat in the side panel. You can then press theSend button in the Chat to send the question.
The C3 Generative AI Chat will search for answers using the set of documents that have been uploaded and indexed for your C3 AI Reliability deployment. You can expect reasonable responses if you ask questions relevant to these documents. If you ask questions about topics ranging outside of these documents, the Chat may not return a relevant response (or may say “I don’t know the answer.”).
See C3 Generative AI Chat for more details about the C3 AI Generative Chat experience in the C3 AI Reliability application.
Reliability Risk Score Summary
The Reliability Risk Score Summary section displays a horizontal bar graph of the Top Contributing Features for theAlert. Each Feature represents a Sensor.
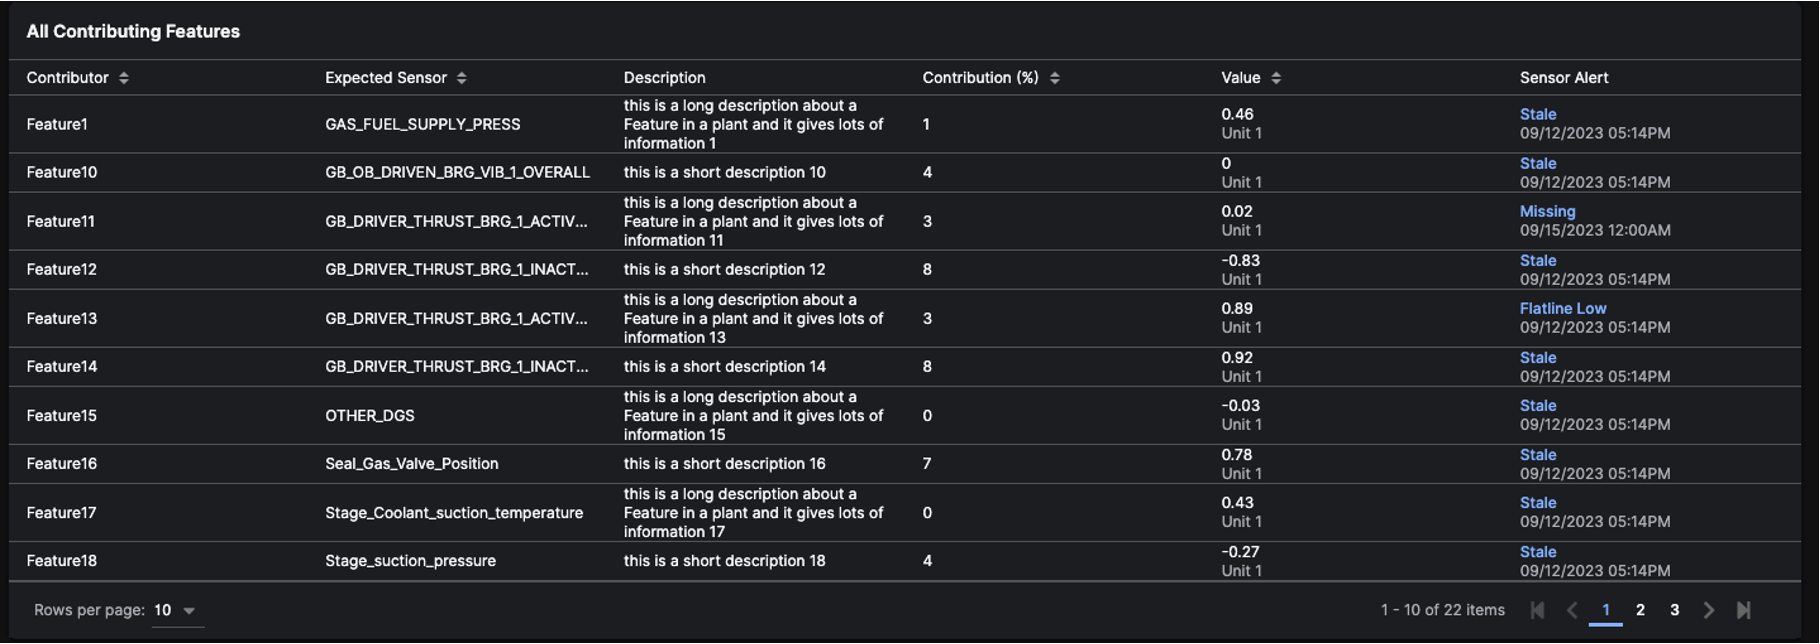
All Contributing Features
The All Contributing Features section shows an aggregated list of theFeatures (Sensors) that contributed to the cause of the Alert. The list also displays the associated Expected Sensor on the Asset and the Sensor Description. In addition, you can see the Contribution Percentage and Current Value for each Feature, as well as any existing Sensor Alerts.
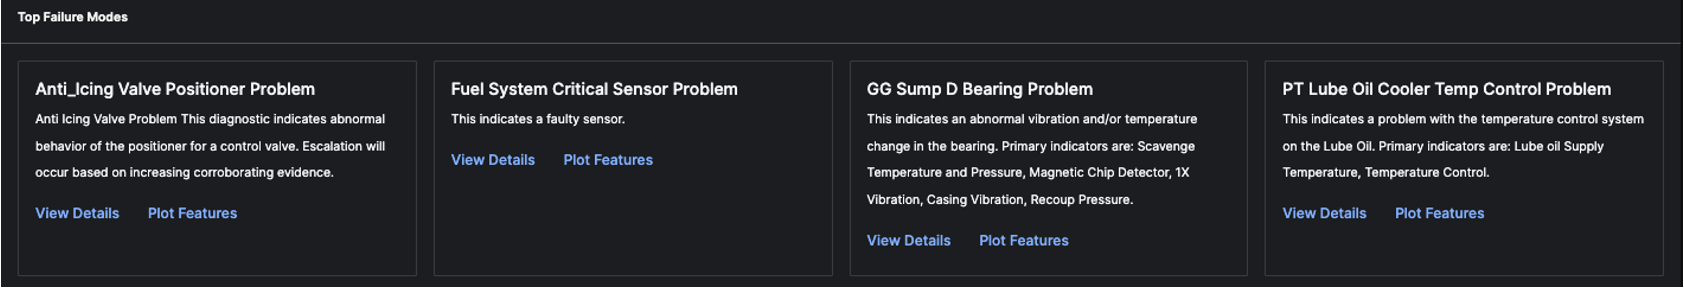
Top Failure Modes
The Top Failure Modes section displays the most probable causes of theAlert, based on the Feature’s relative behavior to the Model’s reconstructed Sensor value. Clicking on ‘View Details’ button displays a modal with Failure Mode details and Recommended Actions. Clicking on ‘Plot Features’ refreshes the timeseries charts below to plot the Features relevant to that Failure Mode.
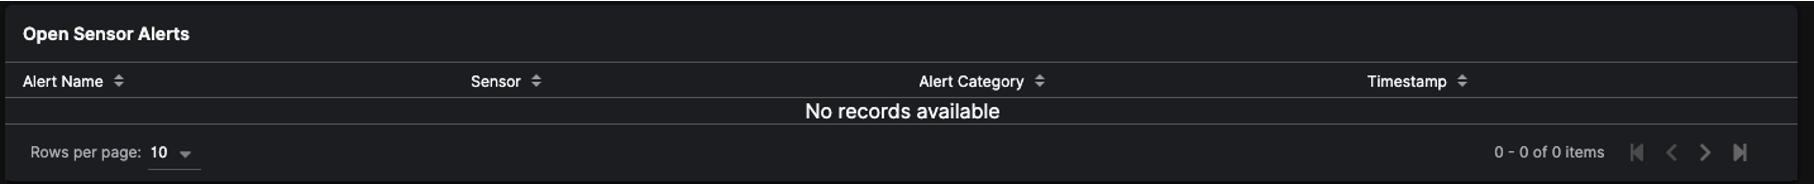
Open Sensor Alerts
The Open Sensors Alerts section lists all of theAlerts that have not been closed yet. Clicking on the Sensor Alert Name redirects to the Sensor Alert Details Page.
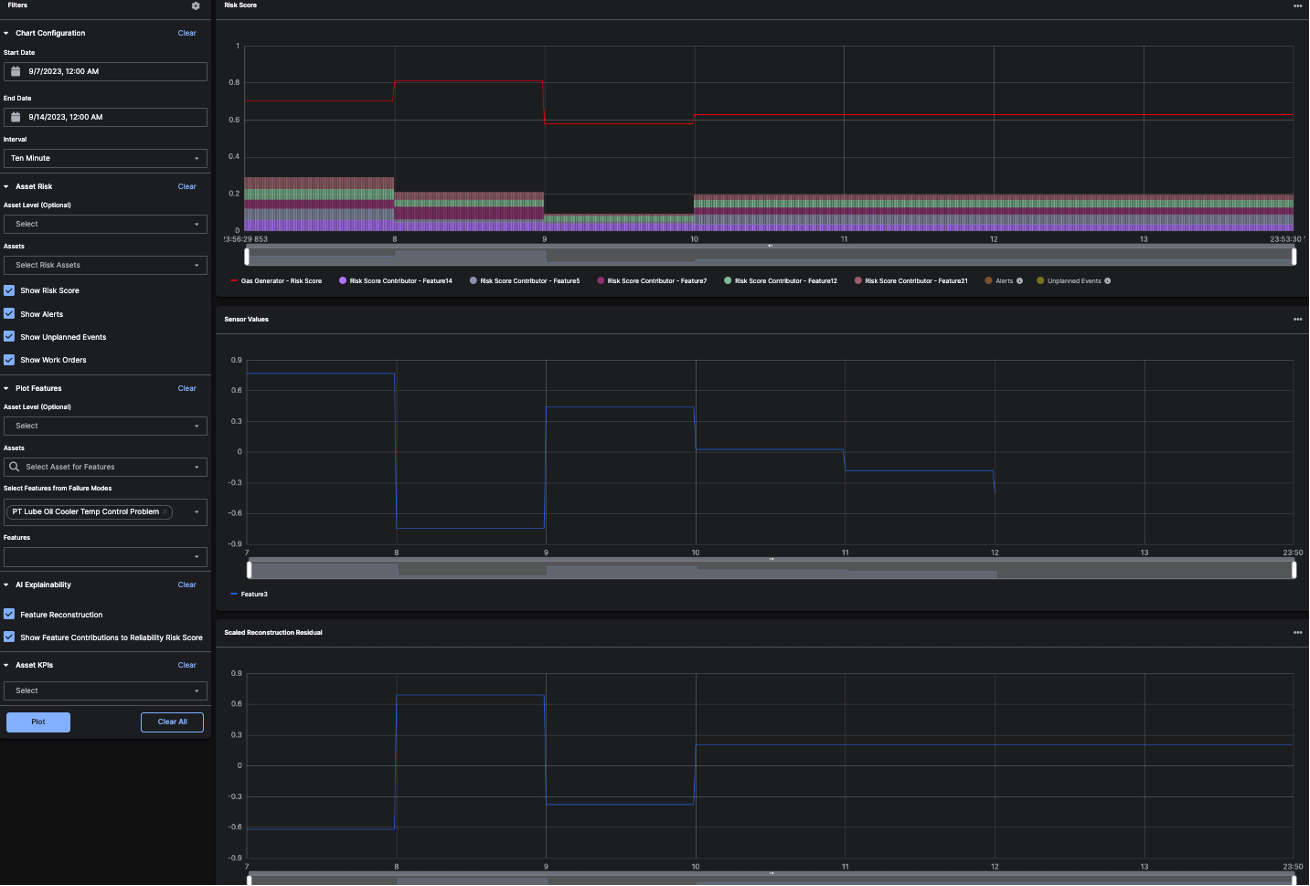
Timeseries Charts
In the Timeseries Charts section, two different charts are pre-configured to help you triage the alert: Model Output and Sensor Values. You can click ‘Plot Features’ from a Failure Mode above or you can use the Filter panel to construct your own charts. You can save the chart configuration to theAlert for future reference by clicking the configuration (gear) icon in the top right of the Filter panel.
Reliability Risk Filter Panel
 The filter panel has six sections to help you triage the alert for reliability risk projects:
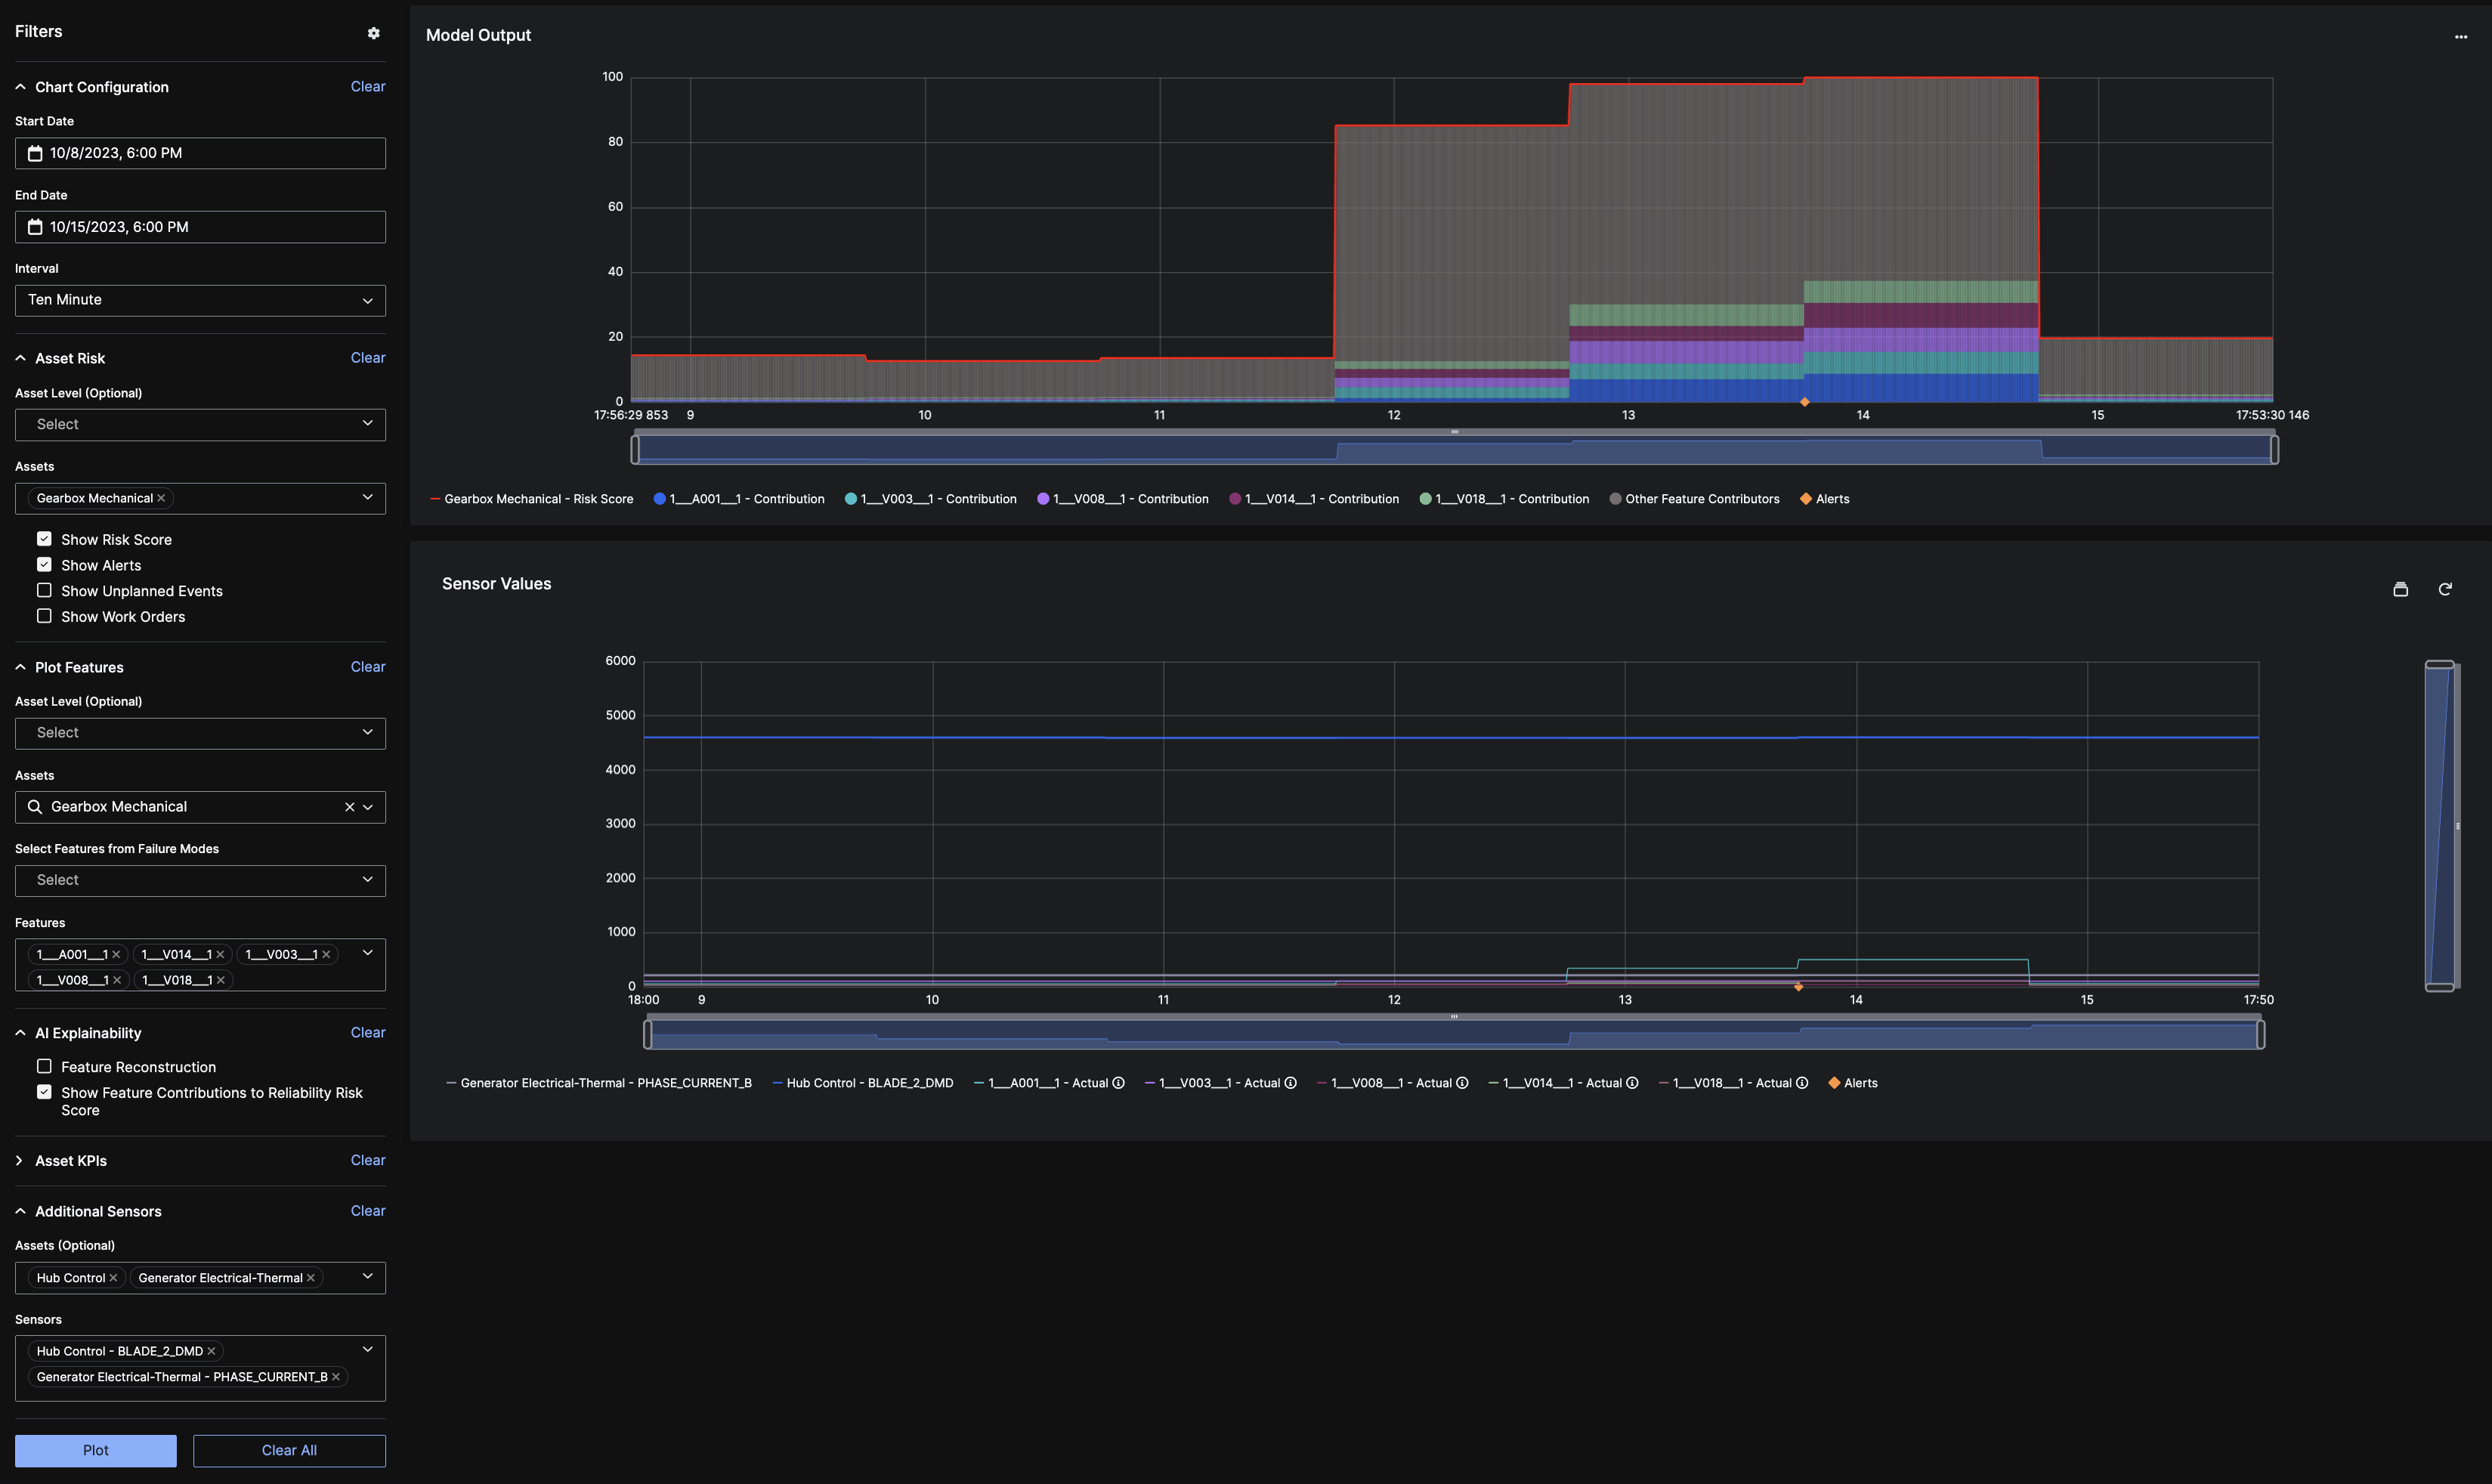
Chart Configuration: the time range and interval configuration to evaluate and plot the filter panel data:Start Date,End DateandInterval.Asset Risk: asset risk configuration. This section hasAsset Level(System, Subsystem, Equipment) andAssetsin this hierarchy level. Both are multiple search fields. You can also select whether to showRisk Score,Alerts,Unplanned EventsandWork Orders.Plot Features: optional asset configuration. This section contains the same fields thatAsset Risk, but also haveSelect Features from Failure Modesand top contributingFeaturesfor theAlertand selectedAsset.AI Explainability: configuration options to decide whether to plotFeature ReconstructionandShow Feature Contributions to Reliability Risk Score.Asset KPIs: multiple search field that specify the key performance indicators (KPIs) for any asset.Additional Sensors: An optional configuration that allows you to add extra sensors to theSensor Valueschart. You can select one or more assets from theAssetsfield, and then choose corresponding sensors from theSensorsfield. If noAssetis selected, theSensorsfield will display sensors without a parentAsset. If multiple assets are selected, theSensorsfield will show sensors associated with any of the chosen assets. The purpose of having this section is to be able to plot theSensors Quantitymetric without losing data that is already plotted, such asFeatures,Feature Reconstruction,Asset KPIs, etc.
Project Agnostic Filter Panel
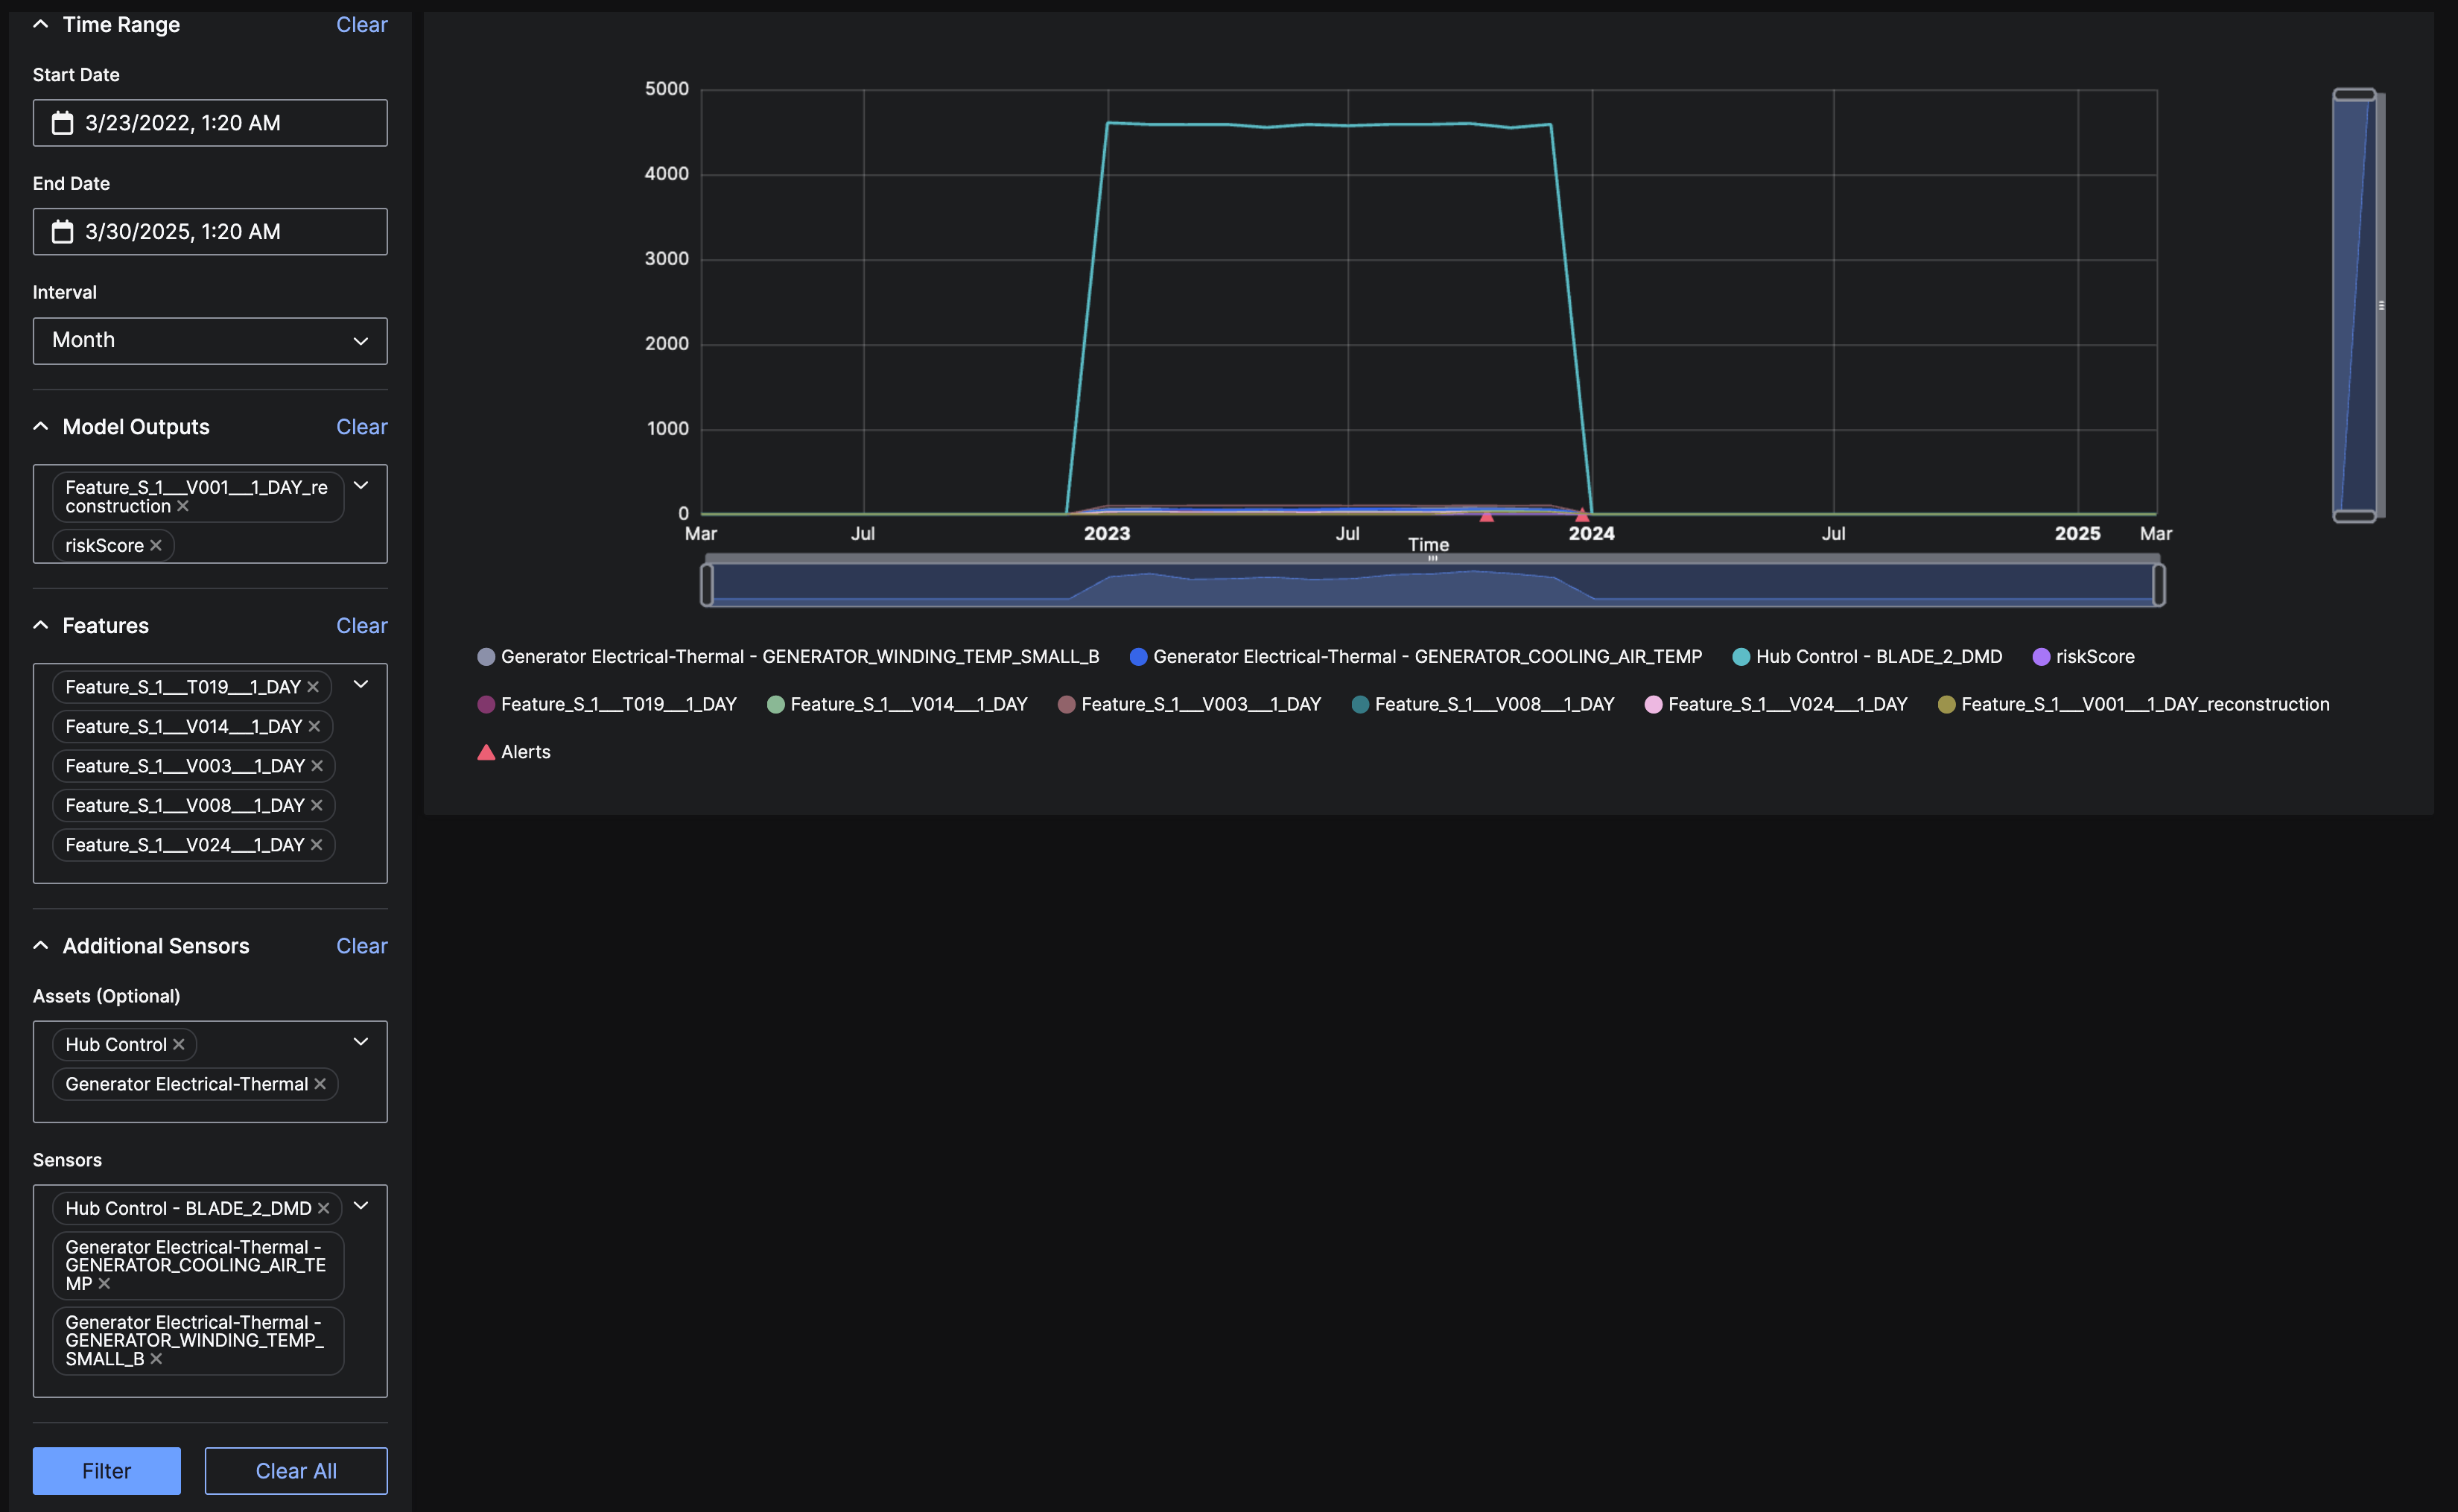 The filter panel has 4 sections to help you triage the alert for project agnostic projects:
Time Range: time configuration to evaluate and plot the filter panel data:Start Date,End DateandInterval.Model Outputs: the outputs of aModelby its correspondingAlertid.Features: the features of the currentAlert. This section contains a multiple search field with the top five contributing features preselected by default.Additional Sensors: this section is the same as the one forReliability Riskprojects.
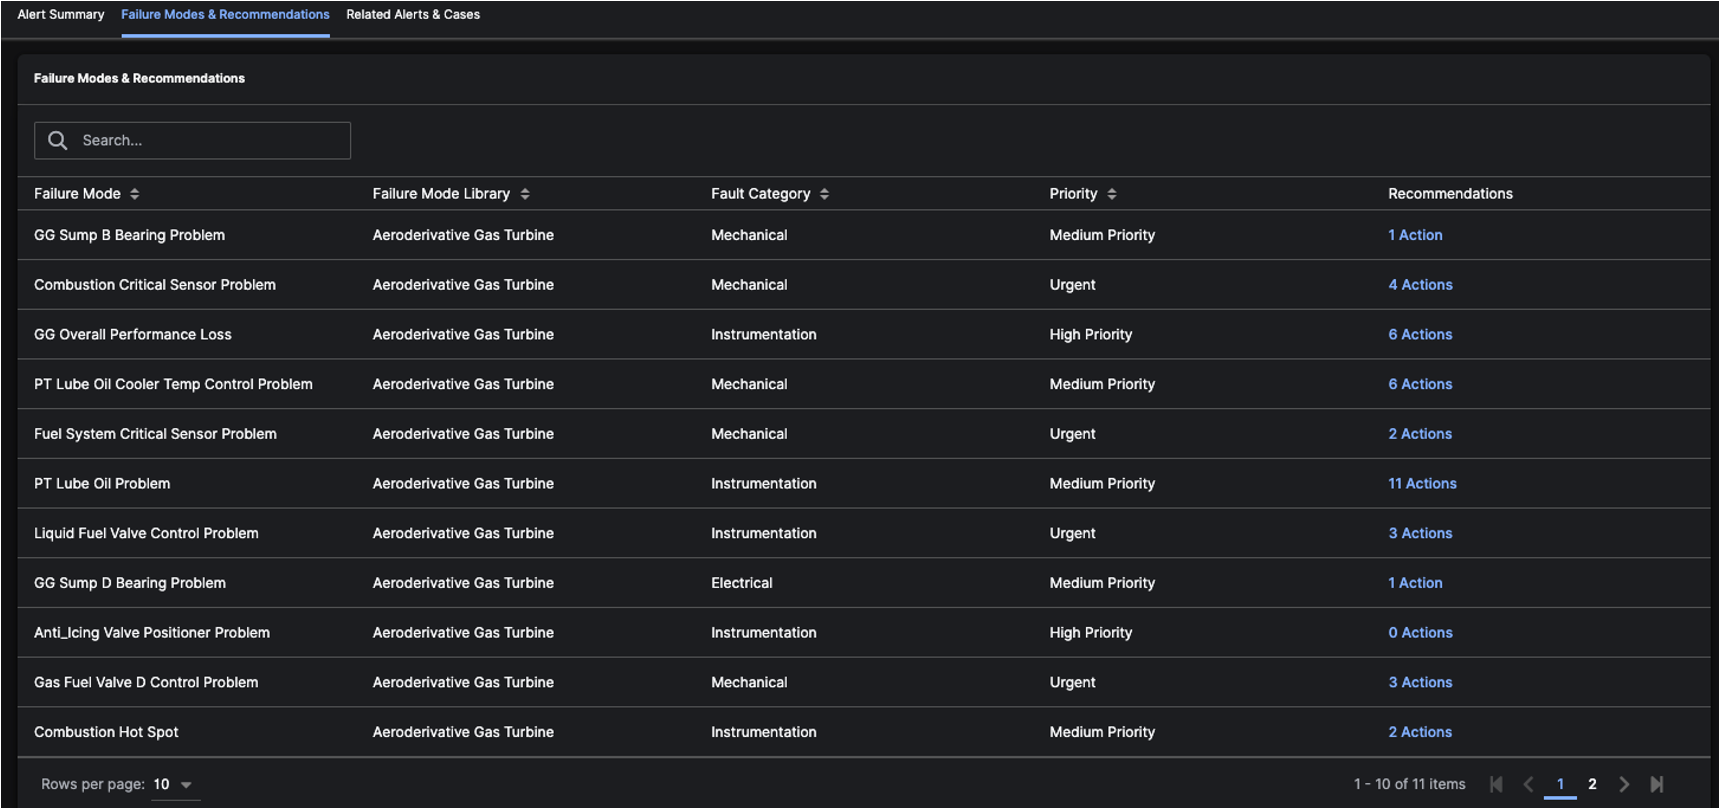
Failure Modes and Recommendations
The Failure Modes and Recommendations tab can give you guidance as to why theAlert was triggered. Clicking on the Recommended Actions displays a modal with suggestions as to how to fix the Alert issue.
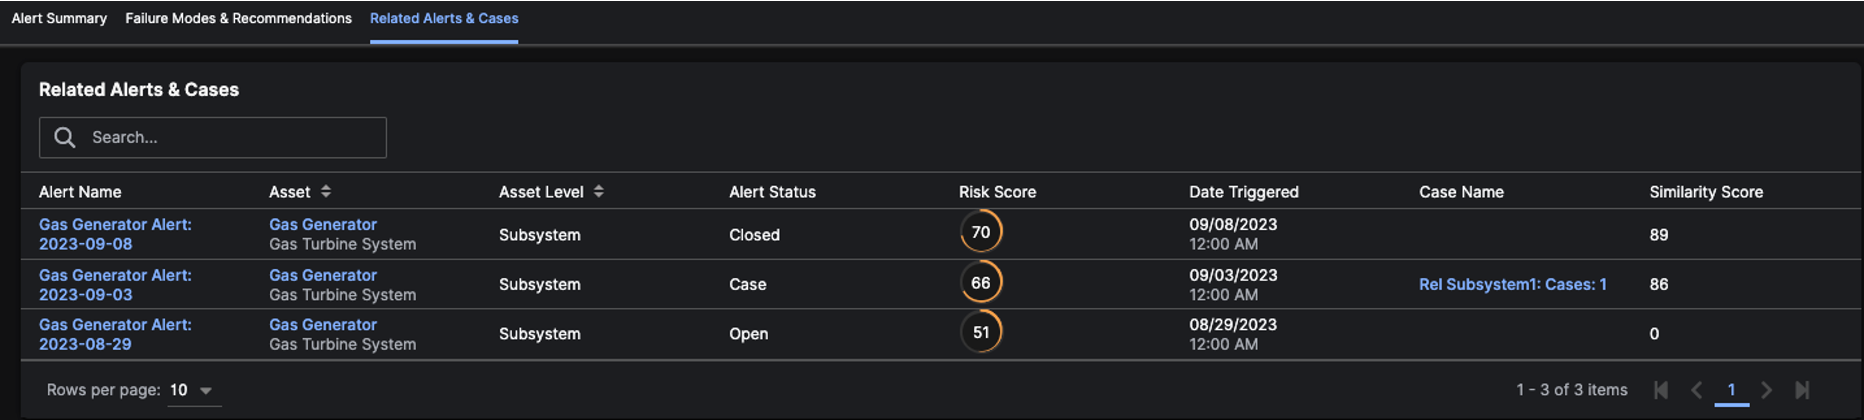
Related Alerts and Cases
The Related Alerts and Cases tab displays other similarAlerts. Clicking on the Alert Name redirects to its Alert Details Page. Clicking on the Asset Name redirects to its Asset Details Page. Clicking on the Case Name redirects to its Case Details Page.
 After viewing details of an
 Alert, you can:
- assign the
Alertto aCaseif it warrant further investigation - close the
Alertif it’s no longer valid - categorize an
Alertand leave feedback so thatModelscan be improved
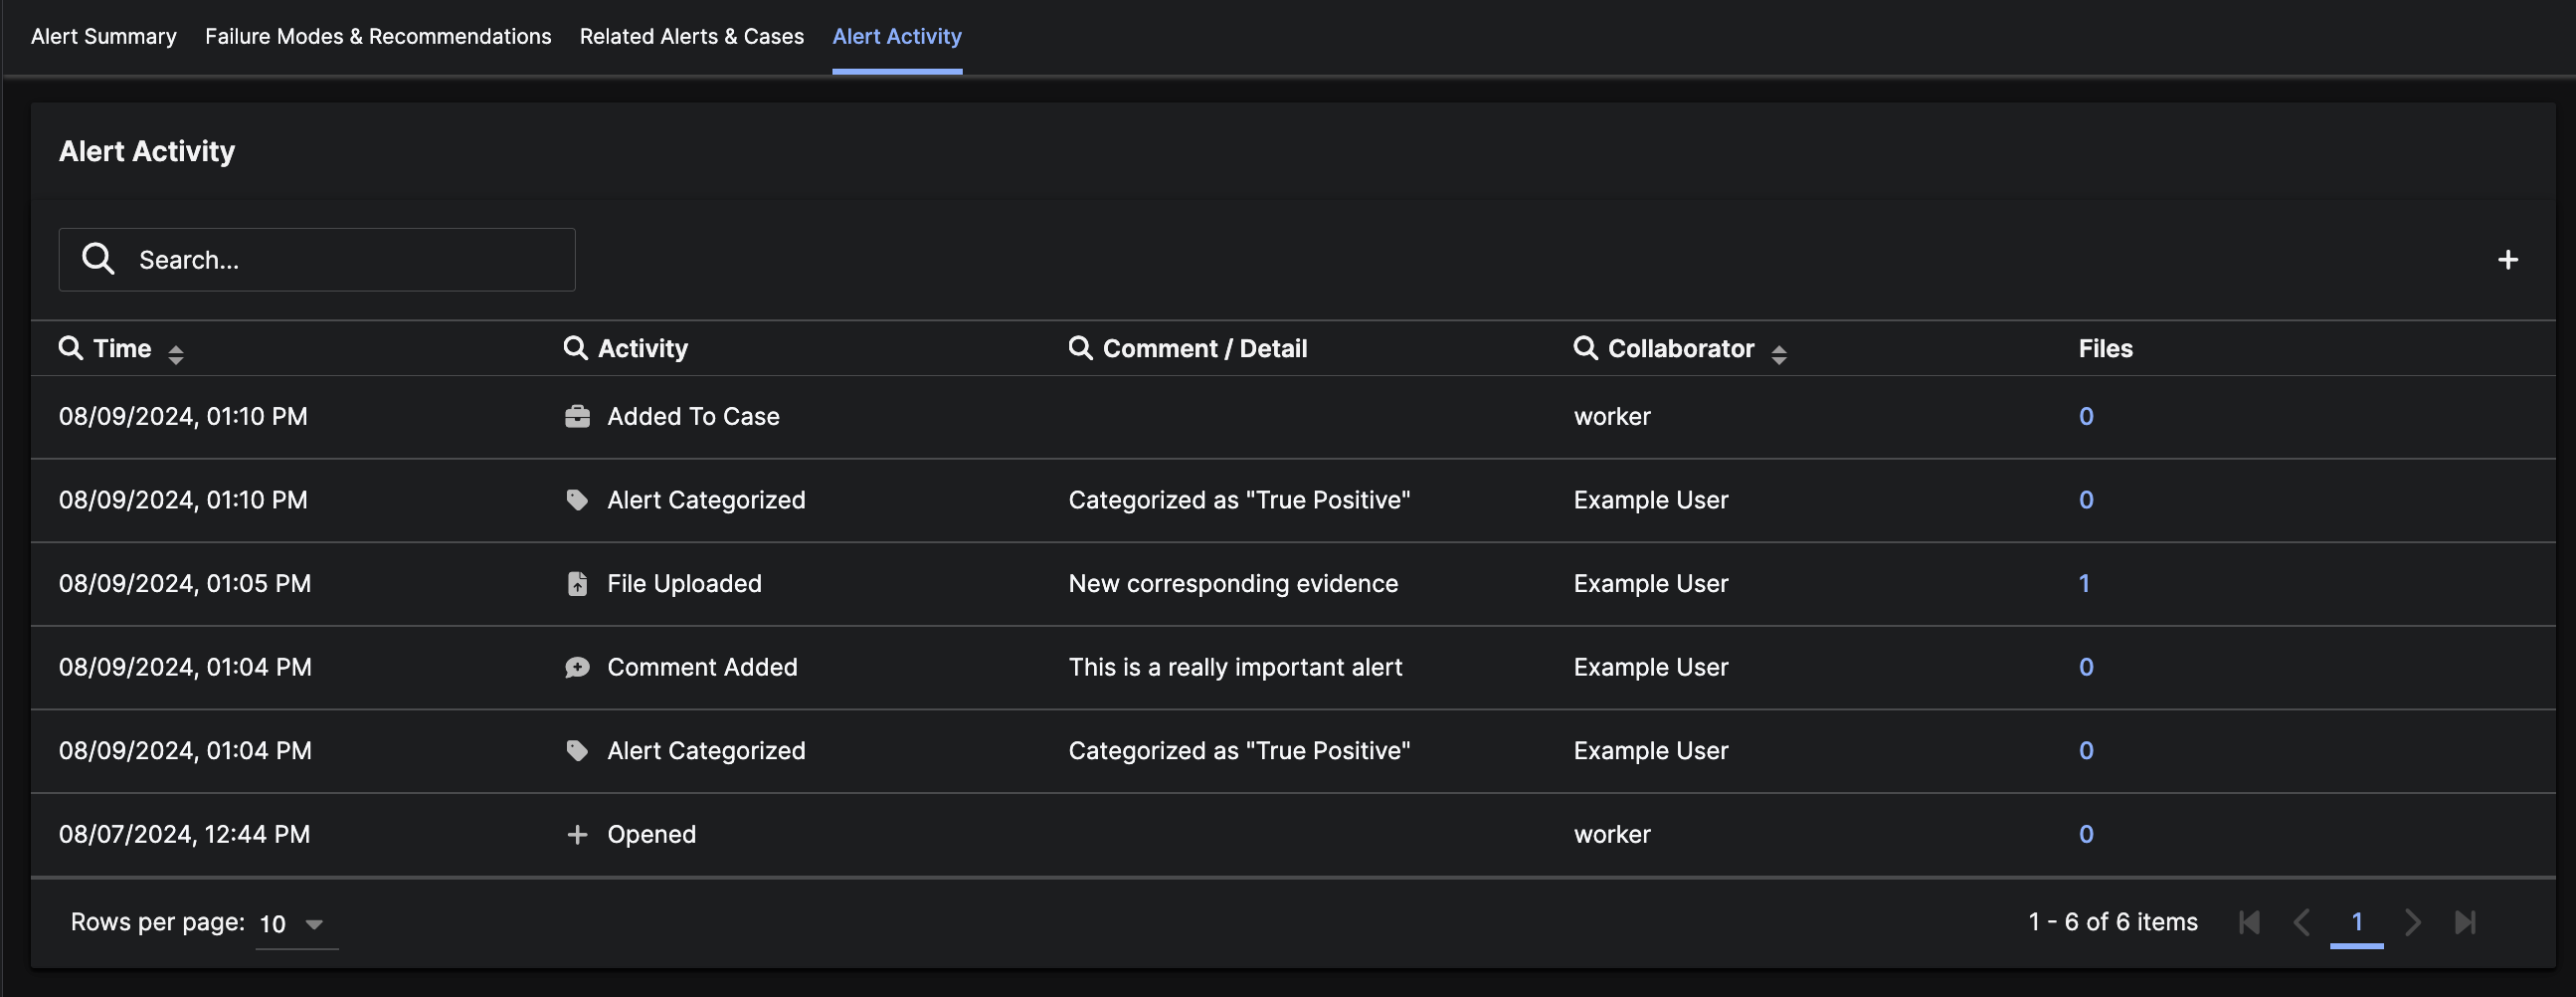
Alert Activity
TheAlert Activity tab contains a log of all the activity that has occurred on this Alert. You can refer to this page to understand who has been working on the Alert and the history of the various actions taken. Types of activities may include:
- Added to Case
- Alert Categorized
- File Uploaded
- Comment Added
- Alert Opened
- Alert Closed