The Asset Details Page appears when you click on anDocumentation Index
Fetch the complete documentation index at: https://devdocs-shaunak-branch.mintlify.app/llms.txt
Use this file to discover all available pages before exploring further.
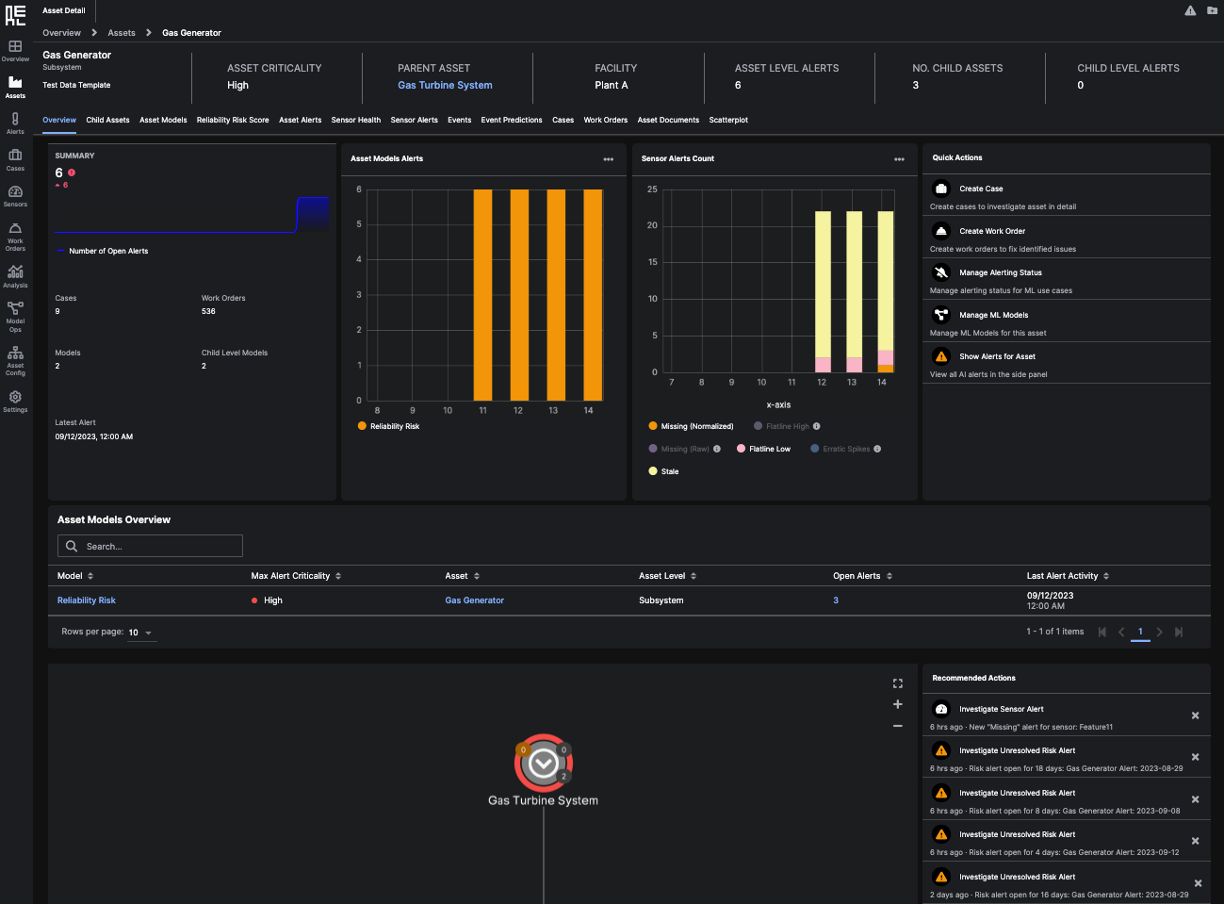
Asset Name from various locations in the application.
 The summary information for the specific
 Asset at the top of the page includes:
- Asset Criticality
- Parent Asset - link redirects to Asset Details Page
- Facility
- Asset Level Alerts
- Number of Child Assets
- Child Level Alerts
Asset.
The tab headings include:
- Overview
- Child Assets
- Asset Models
- Reliability Risk Score
- Asset Alerts
- Sensor Health
- Sensor Alerts
- Events
- Event Predictions
- Cases
- Work Orders
- Asset Documents
- Scatter Plot
Overview Tab
The Overview tab opens by default when you click on anAsset within a list or grid.
This tab contains a page of asset information that is separated into three graph sections:
- Asset Summary
- Asset Model Alerts
- Sensor Alerts Count
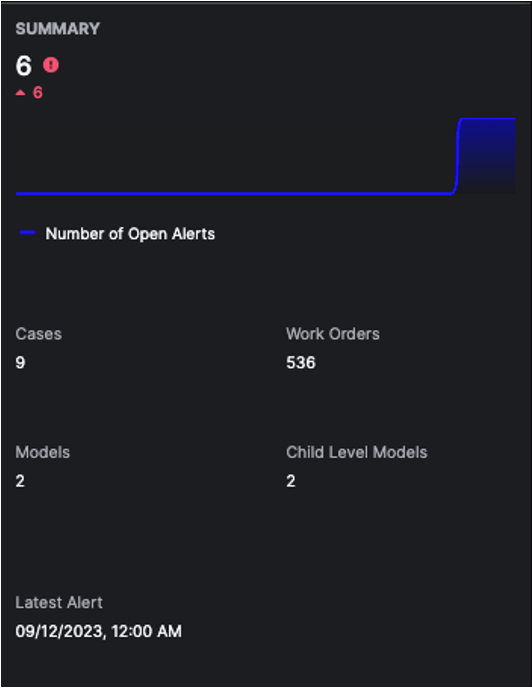
Asset Summary
The Asset Summary section displays aggregated numbers forOpen Alerts, Work Orders, Models, and Child Level Models.
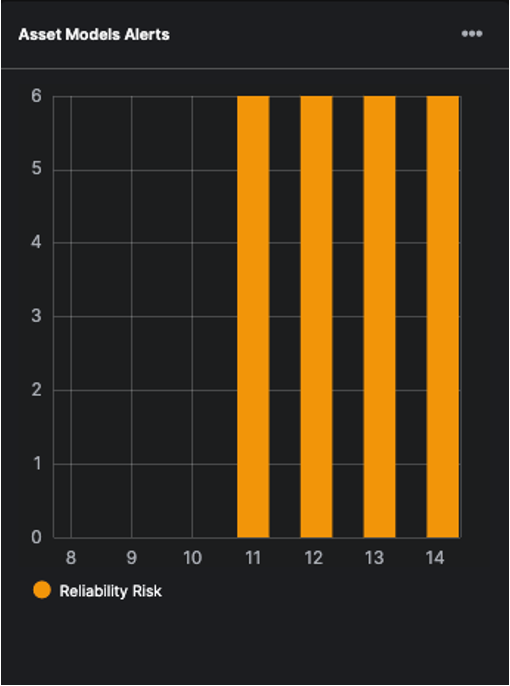
Asset Model Alerts
The Asset Models Alerts section displays a bar graph showing an aggregation of the number ofAlerts for each model on the Asset for the previous 7 days.
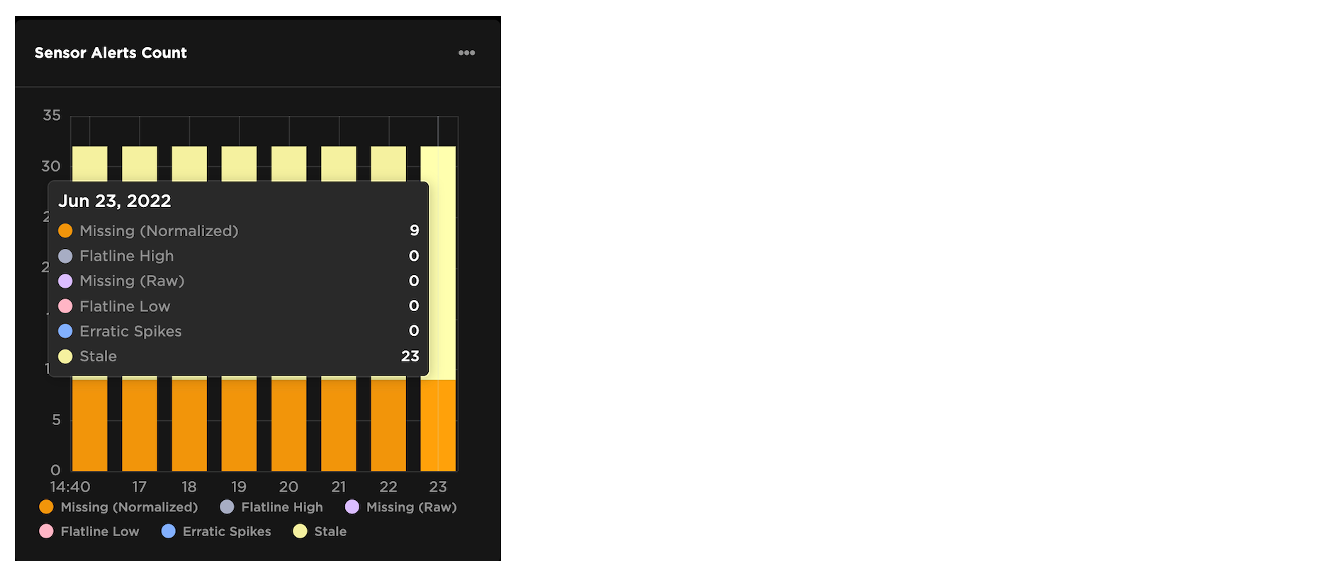
Sensor Alerts Count
The Sensor Alerts Count section displays a bar graph showing an aggregation of the number ofSensor Alert for the previous 7 days. Sensor Alert types are:
- Missing (Normalized)
- Missing (Raw)
- Flatline High
- Flatline Low
- Stale
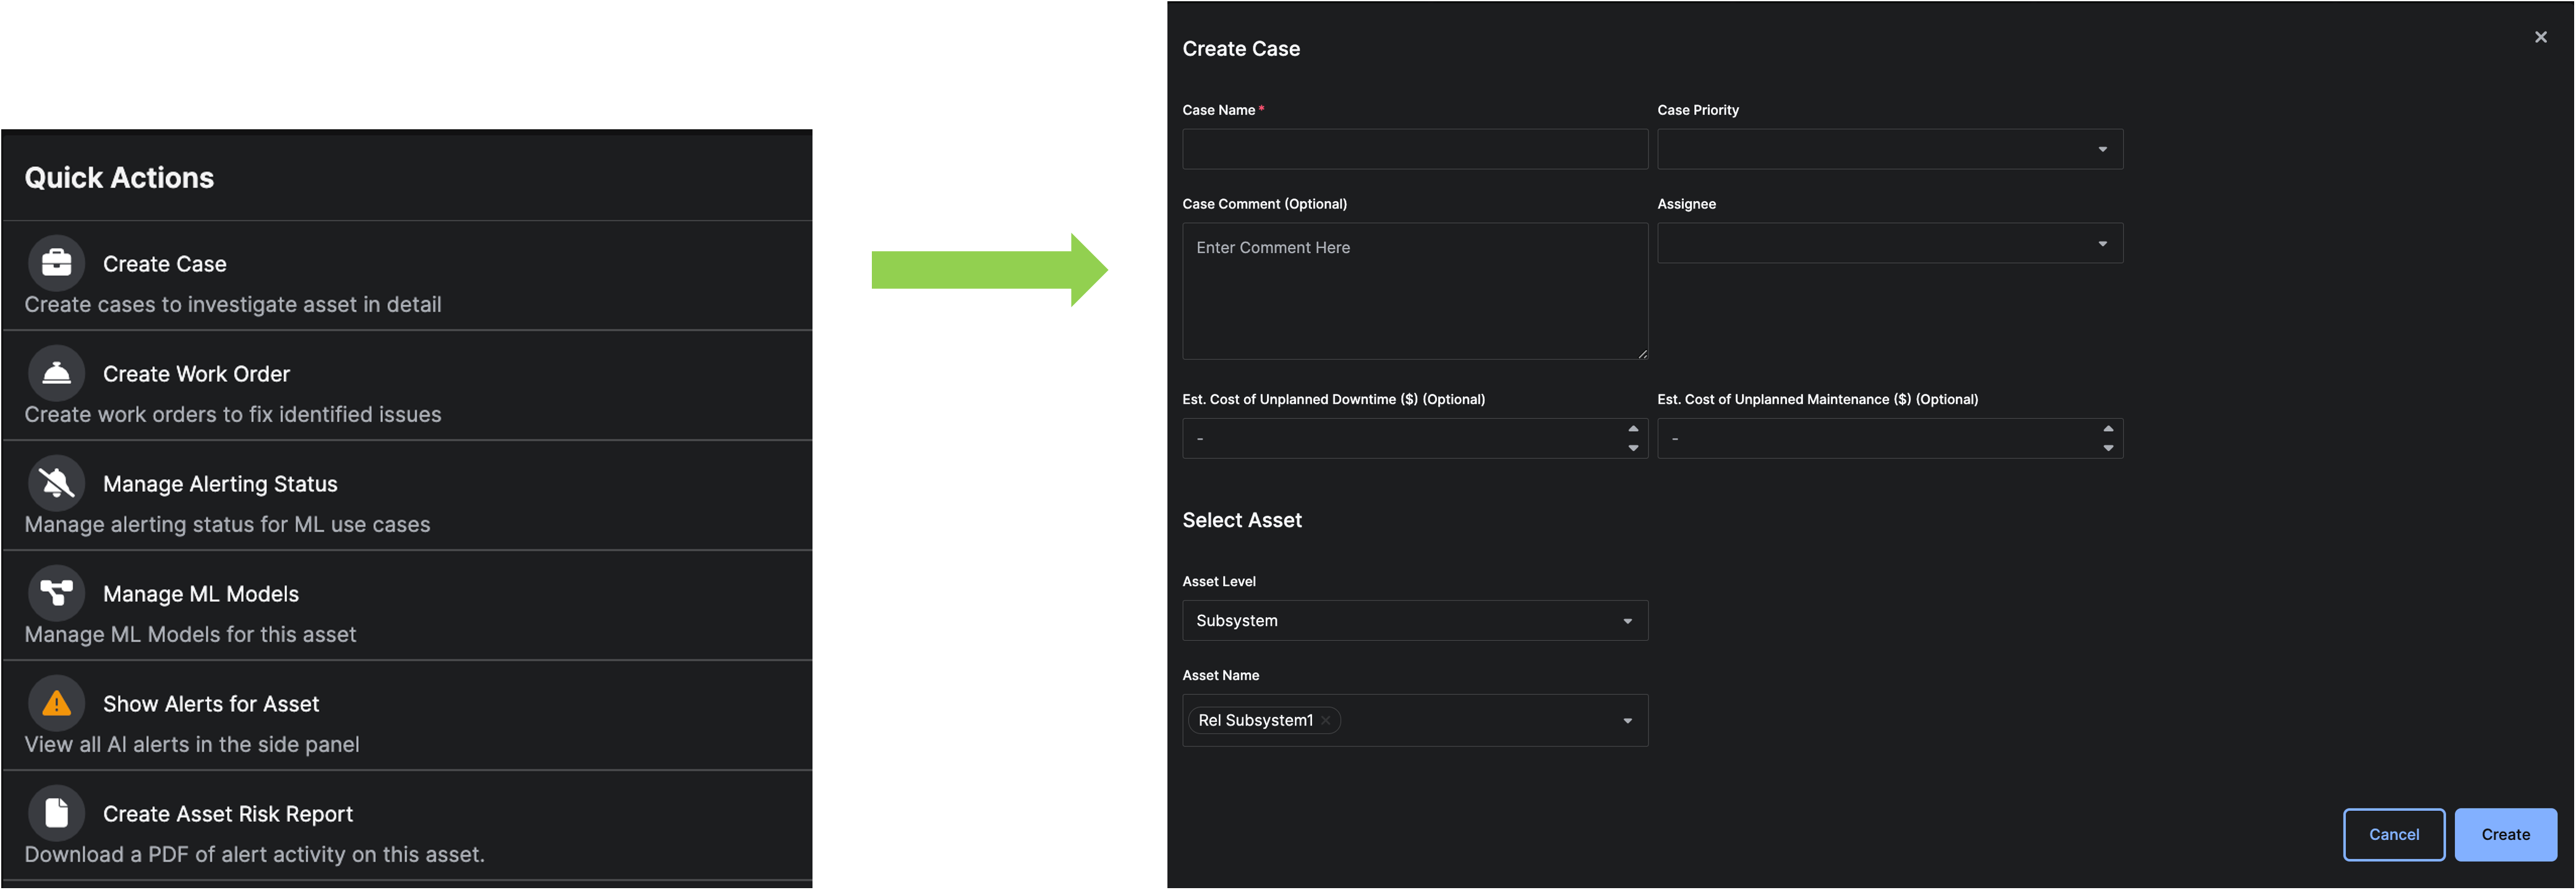
Quick Actions
The Quick Actions section allows you to perform actions related to a specificAsset directly from the Asset Details Page.
The Create Case action allows you to create a Case to associate with the Asset. Create a Case to track your research for an Alert.
 The
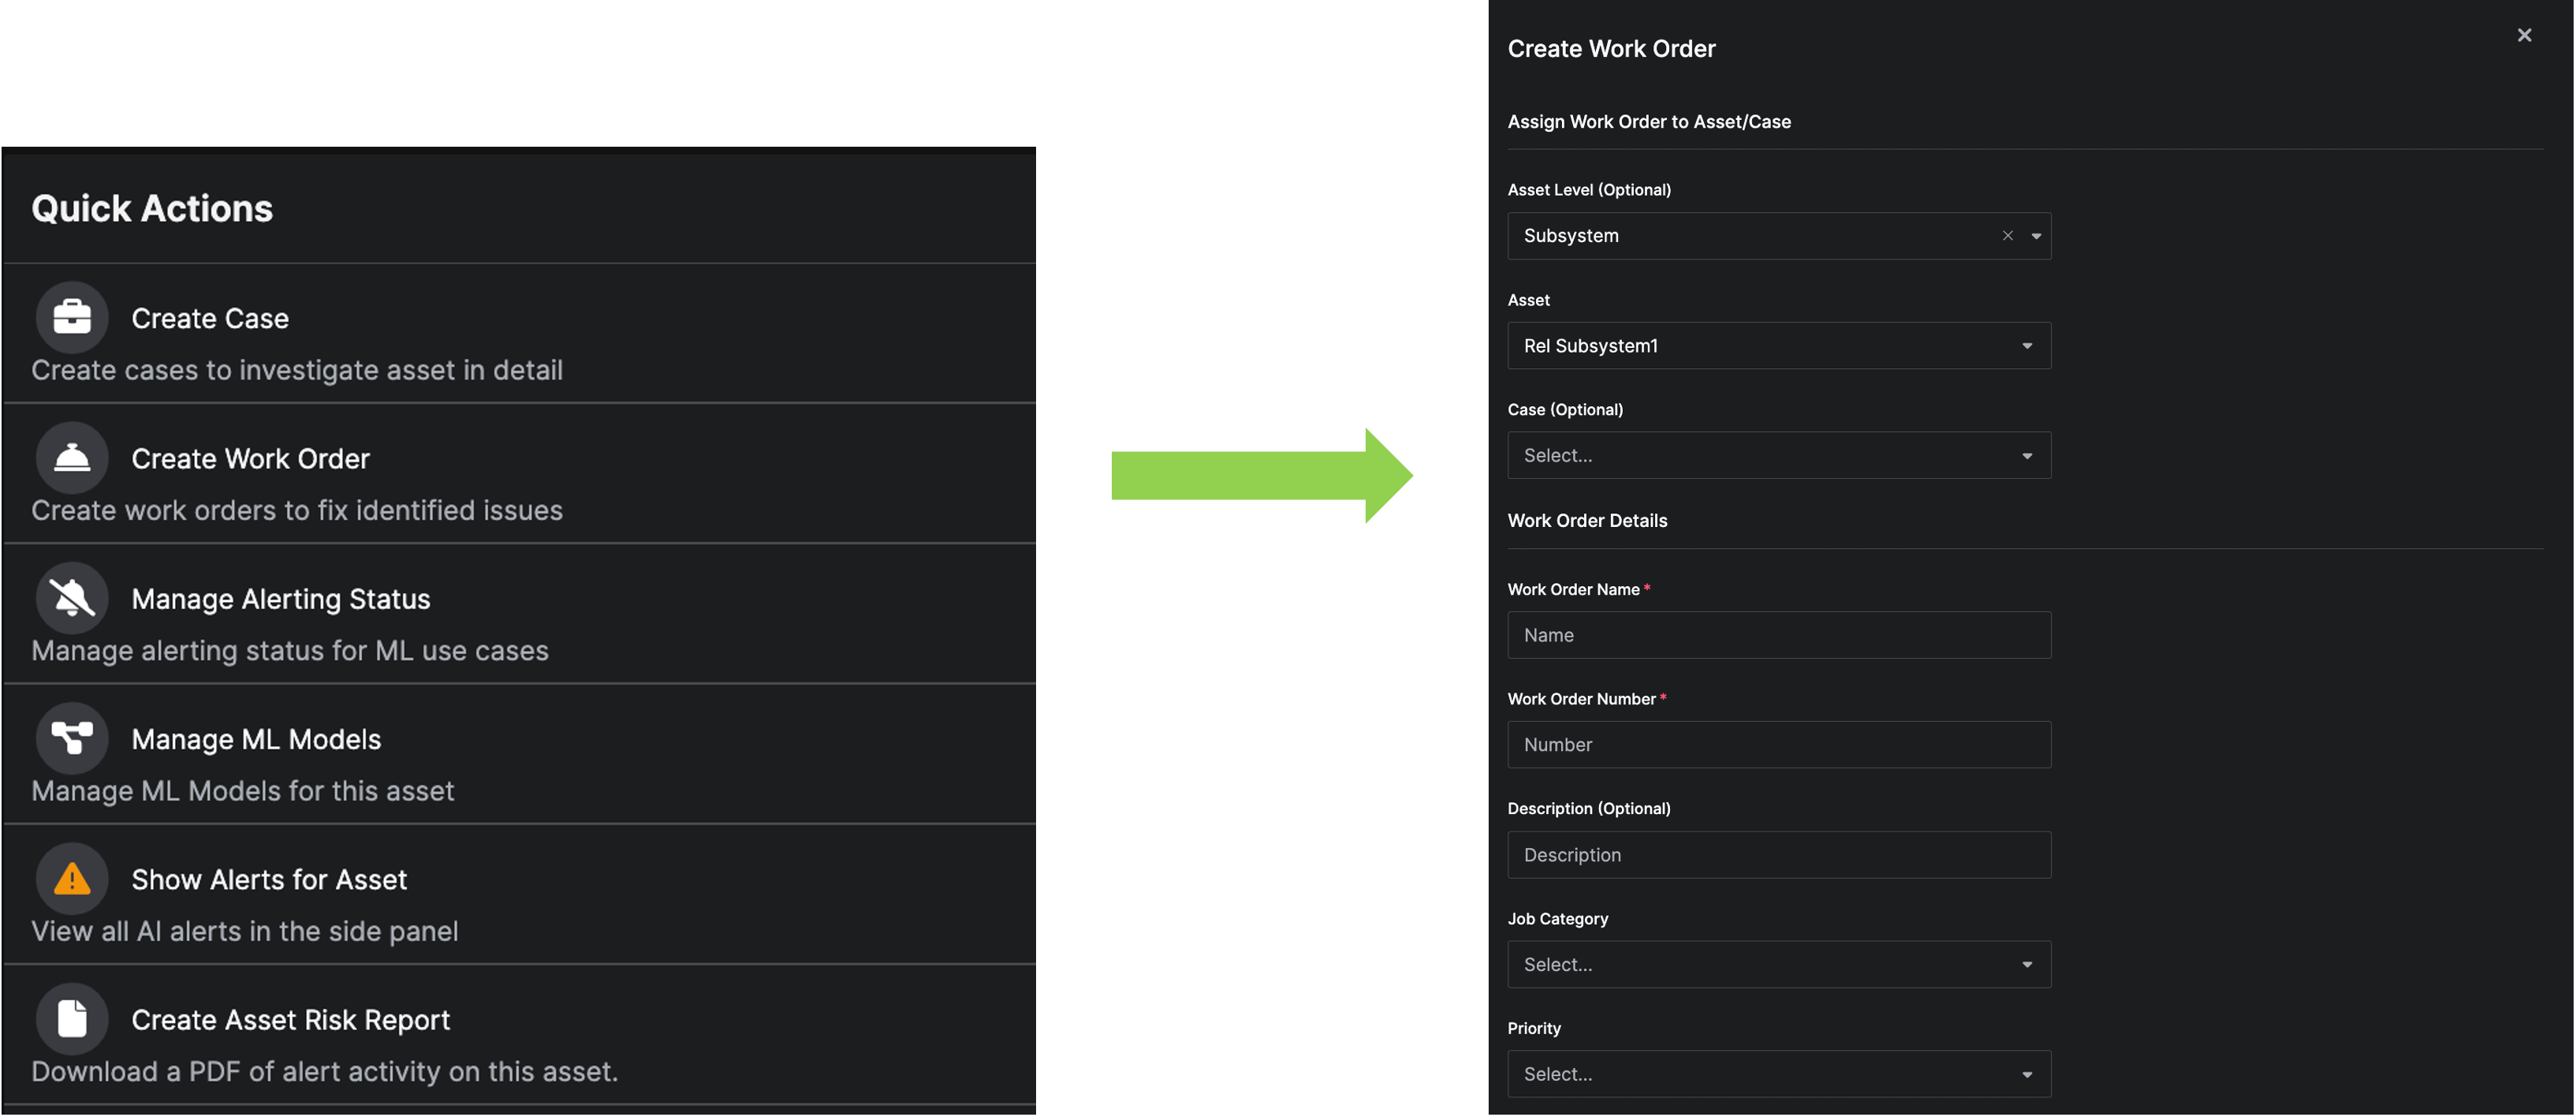
The Create Work Order action allows you to create a Work Order from within the Asset Details Page. Create a Work Order to assign a task related to a specific Alert and Asset.
 The
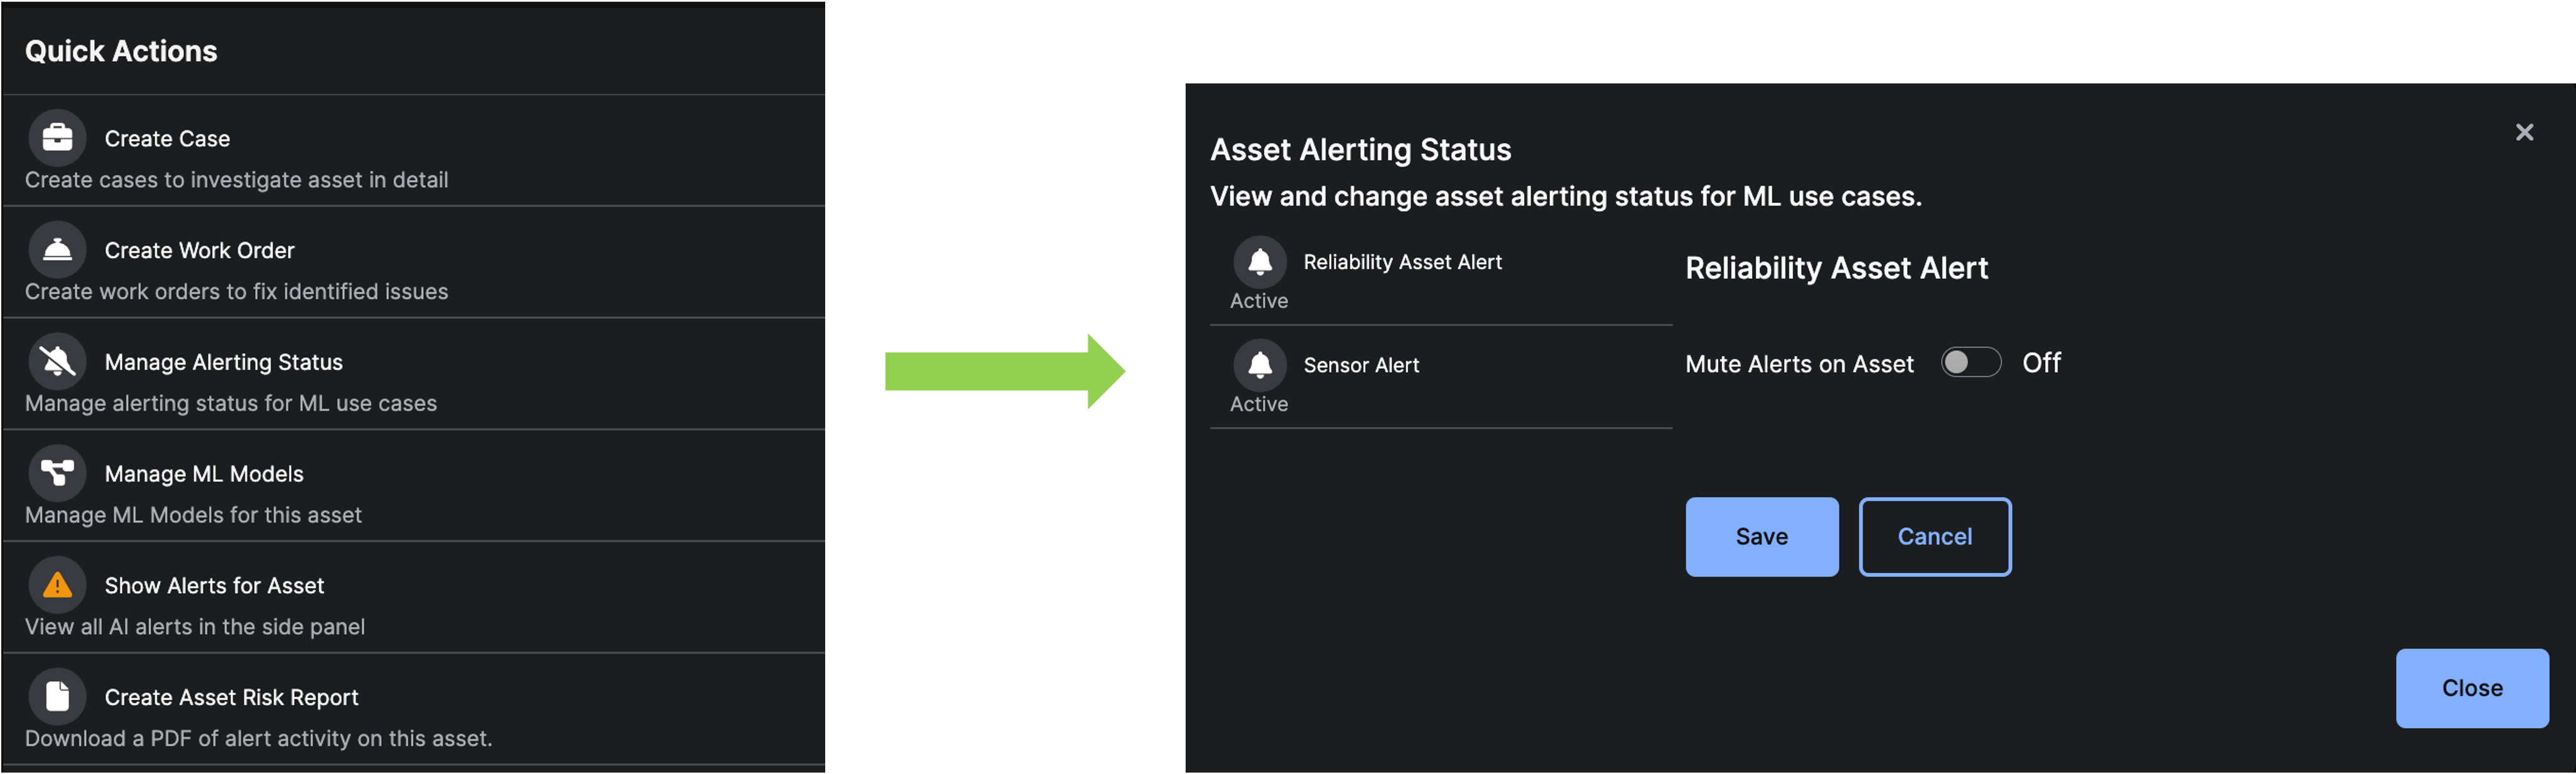
The Manage Alerting Status action allows you to mute Asset Alerts and Sensor Alerts associated with the Asset for a specific duration of time.
 The
The Manage ML Models action allows you to bring up the Model Operations Page for the Asset.
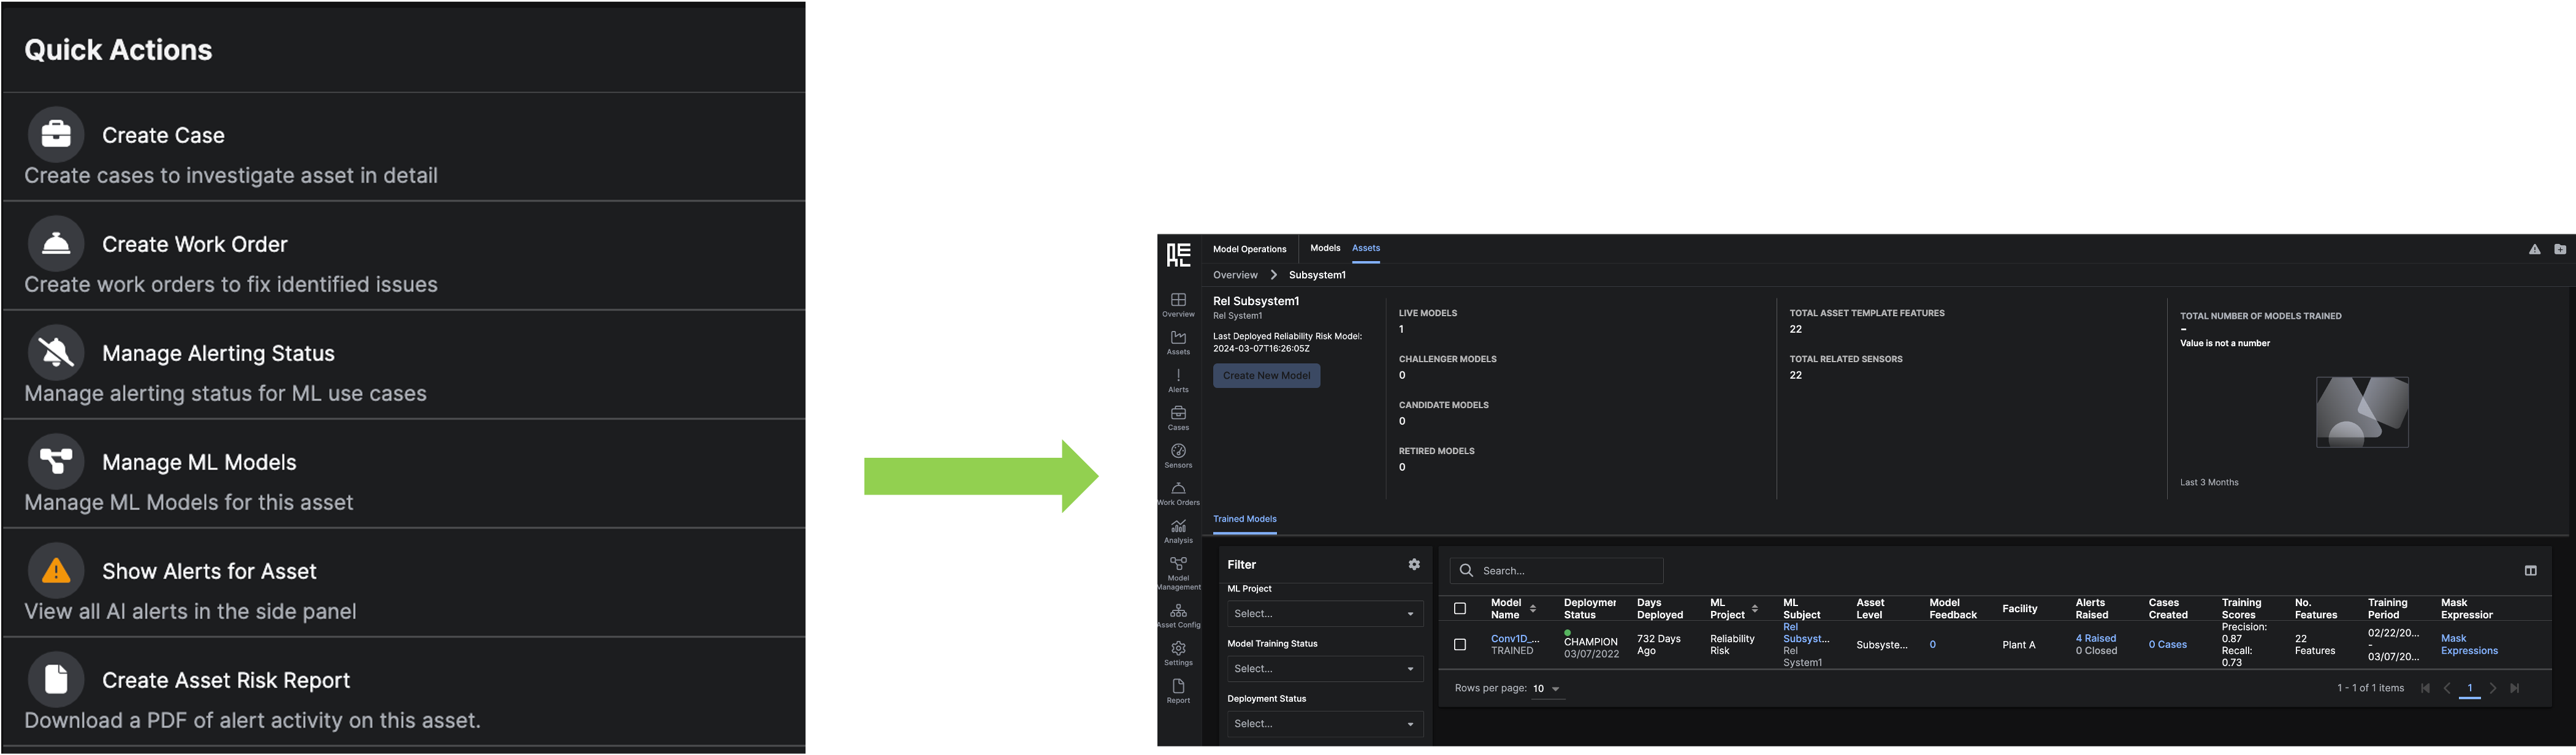 The
The Show Alerts for Asset action opens a side panel to show open Alerts for the Asset.
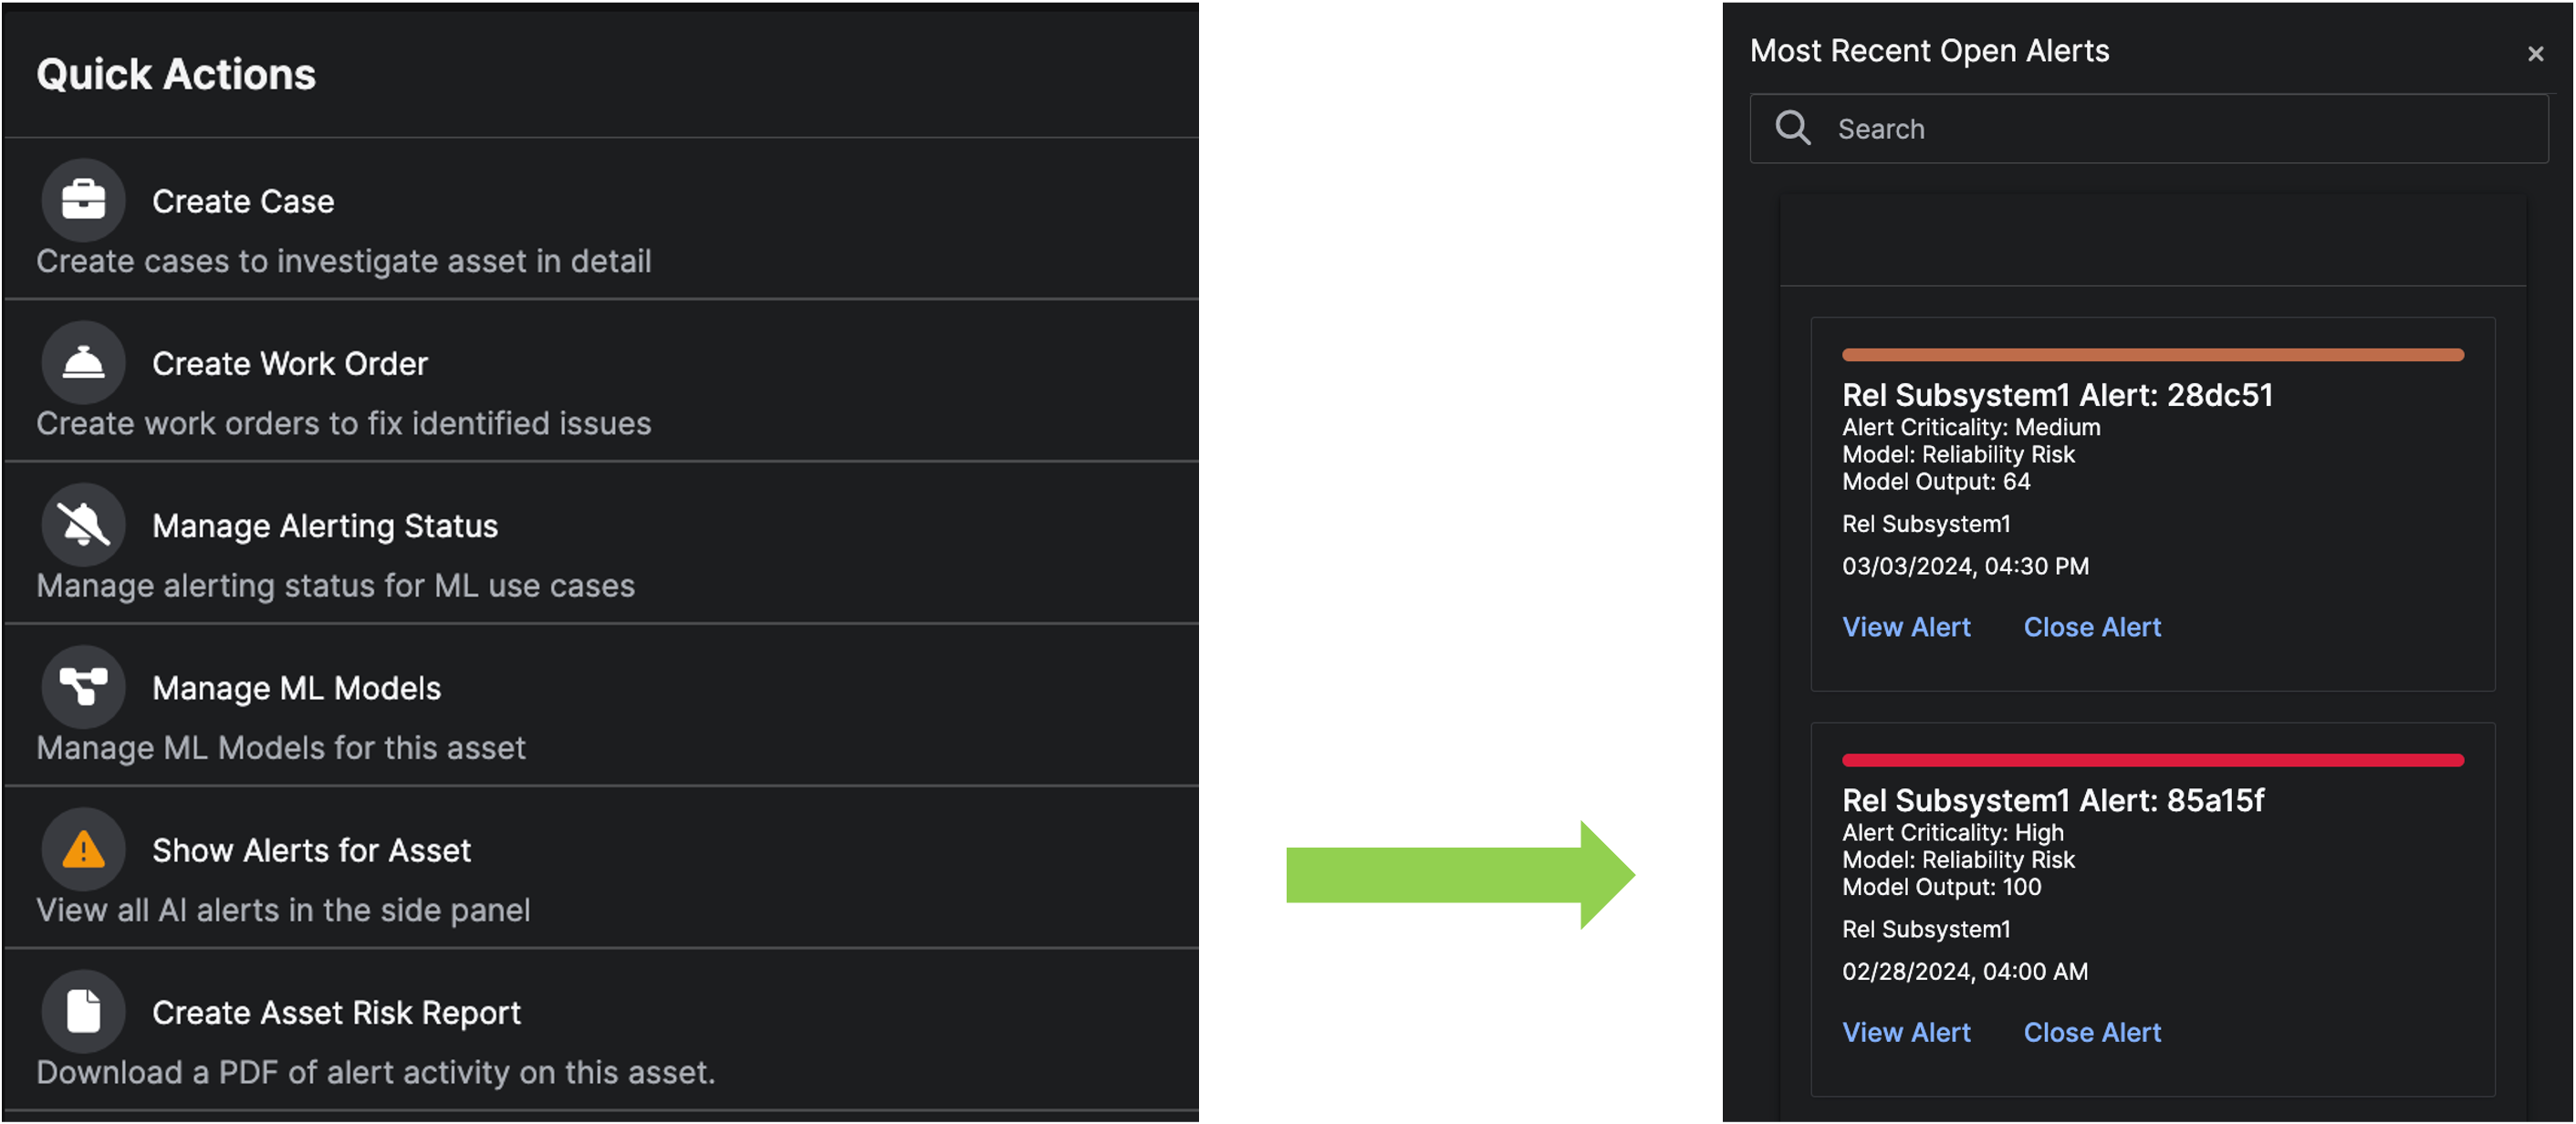 The
The Create New Model action redirects you to the Model Setup page for the specific Asset previously shown on the Asset Detail page.
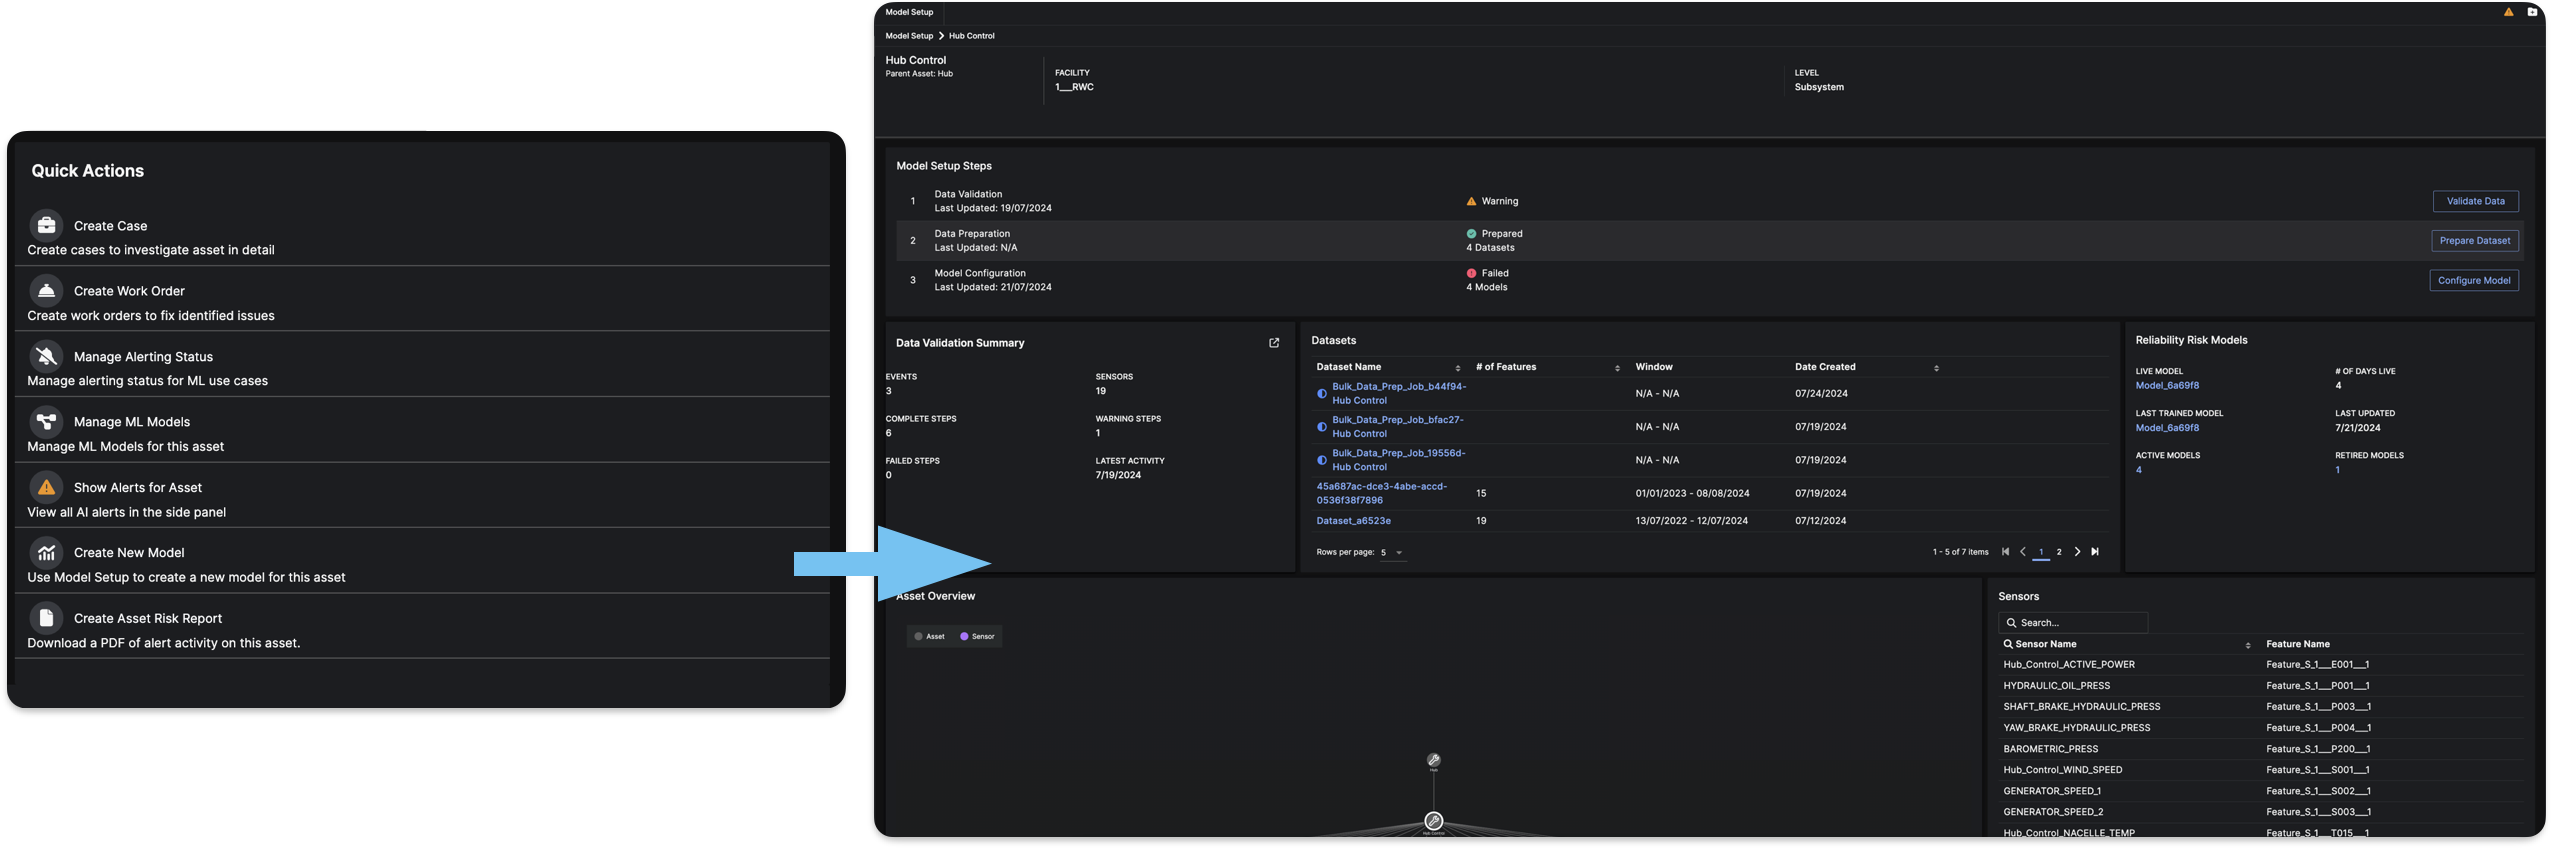 The
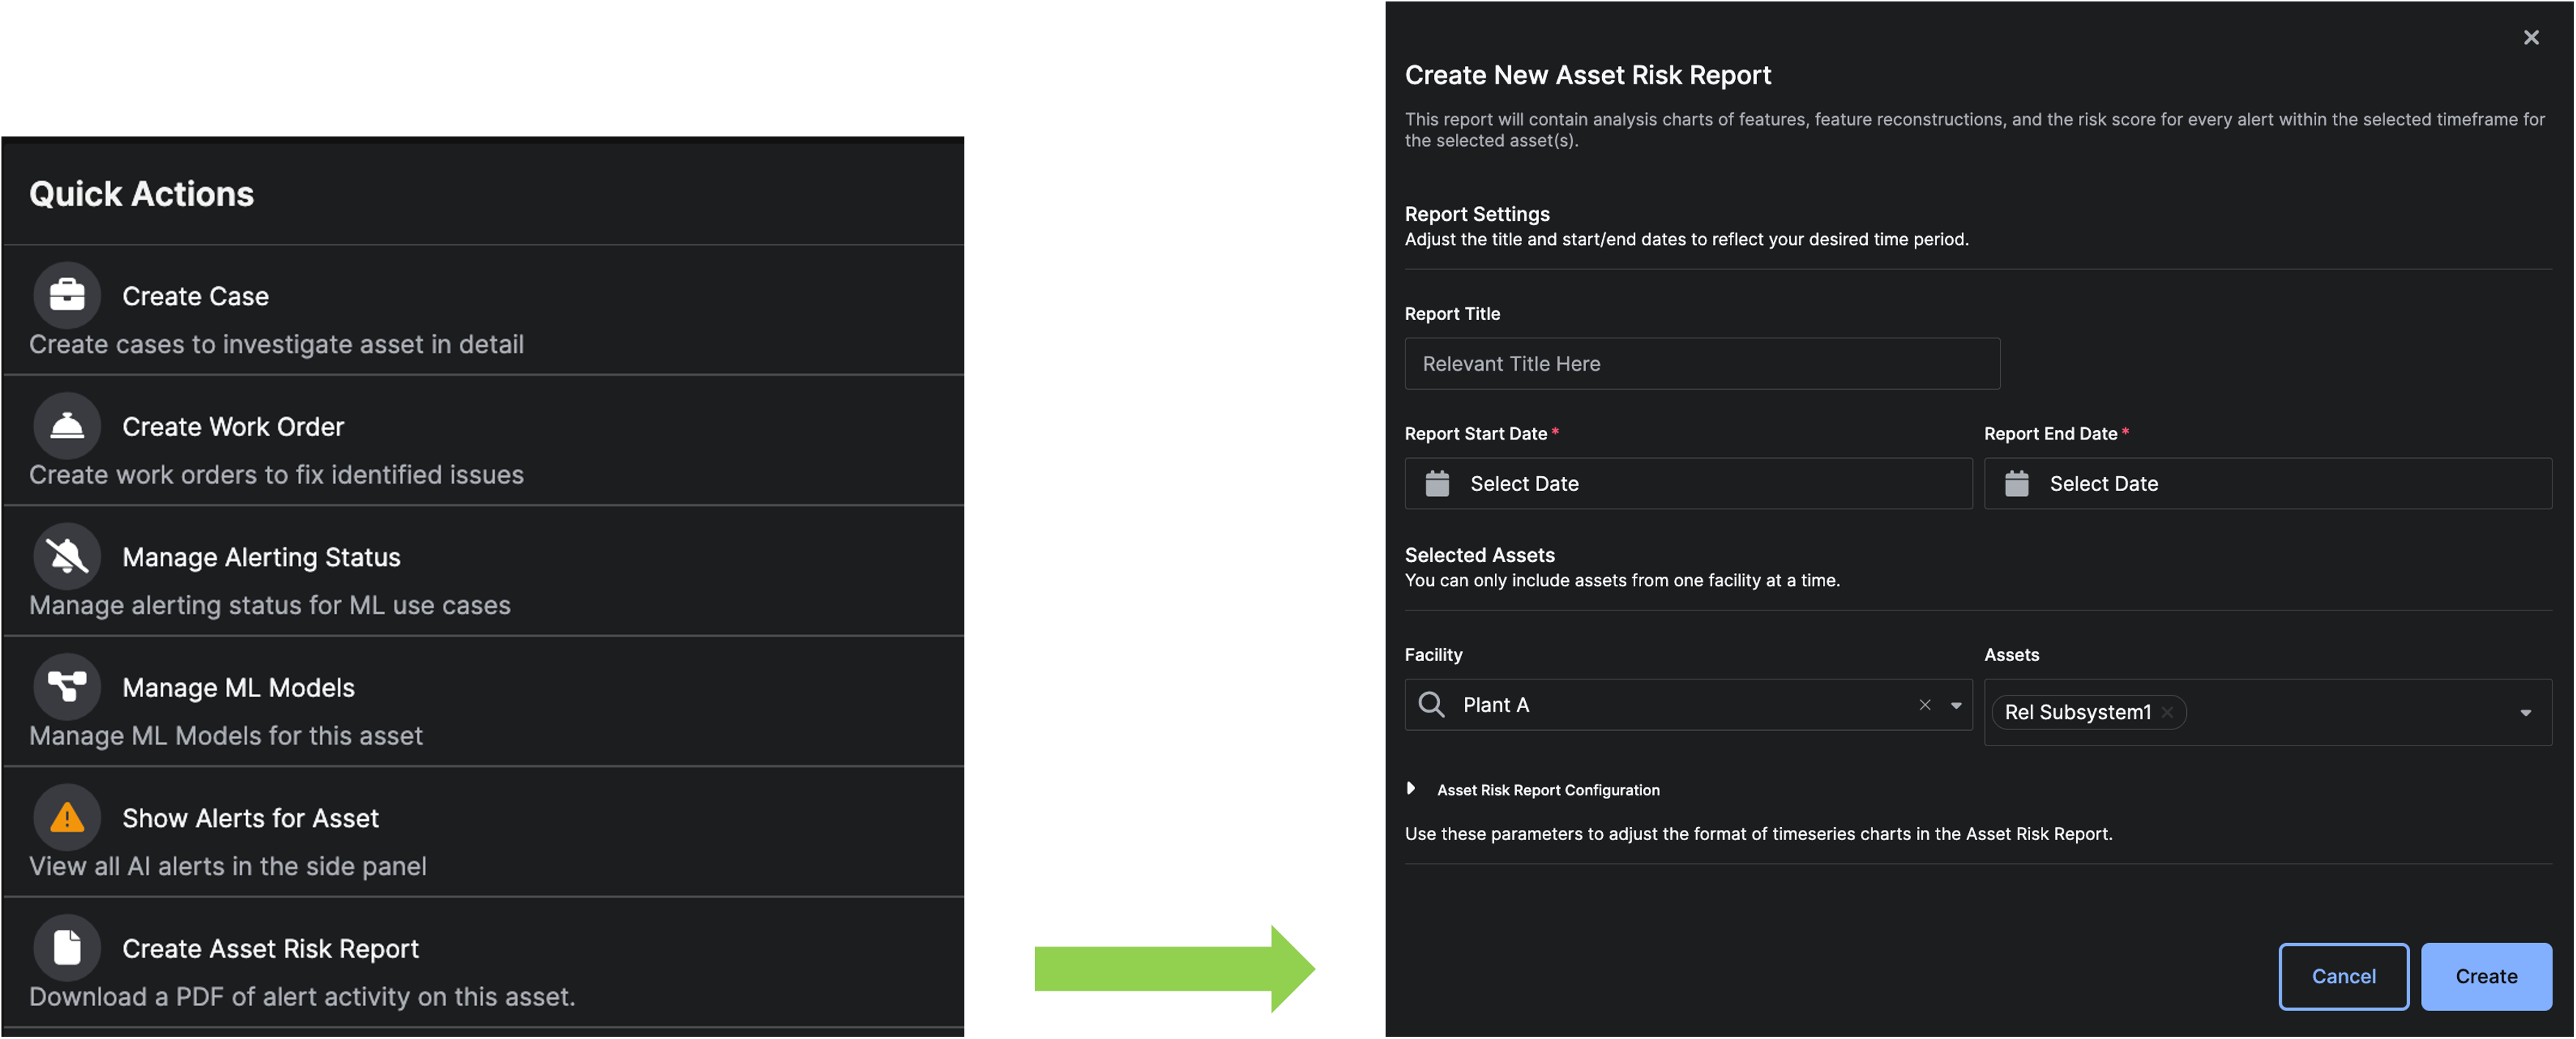
The Create Asset Risk Report action allows you to generate a PDF Report with information about alerts on the Asset, to quickly provide a summary of the asset’s behavior over a set period of time.
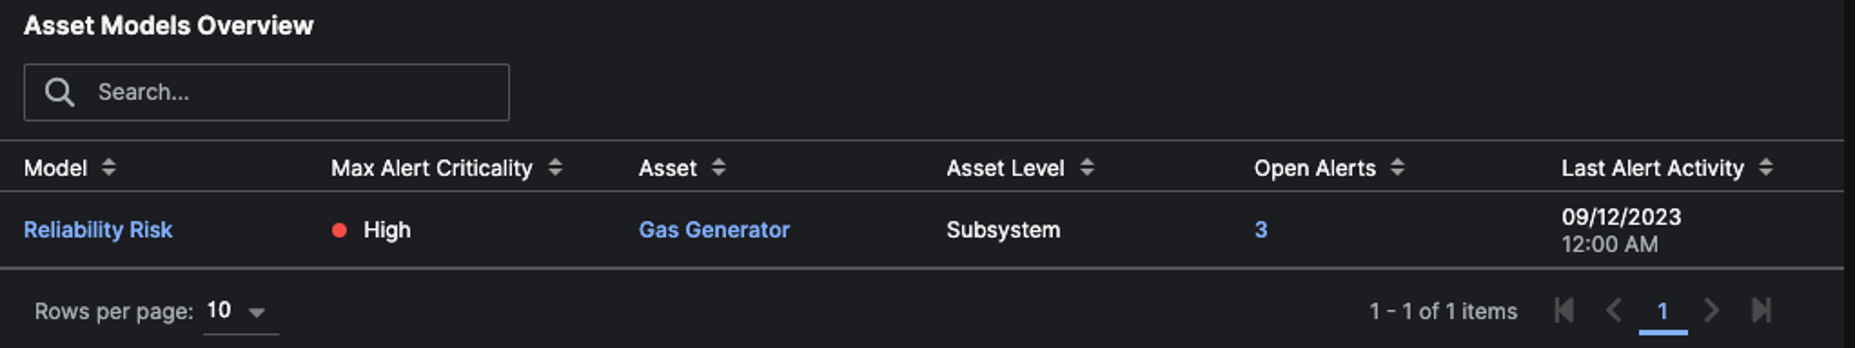
Asset Models Overview
The Asset Models Overview section lists all of the liveModels associated with the Asset. Clicking on the Model Name redirects to the Models Details Page. Clicking on the Asset Name redirects to the Asset Details Page. Clicking on the Open Alerts opens a side panel to show open Alerts for that Model.
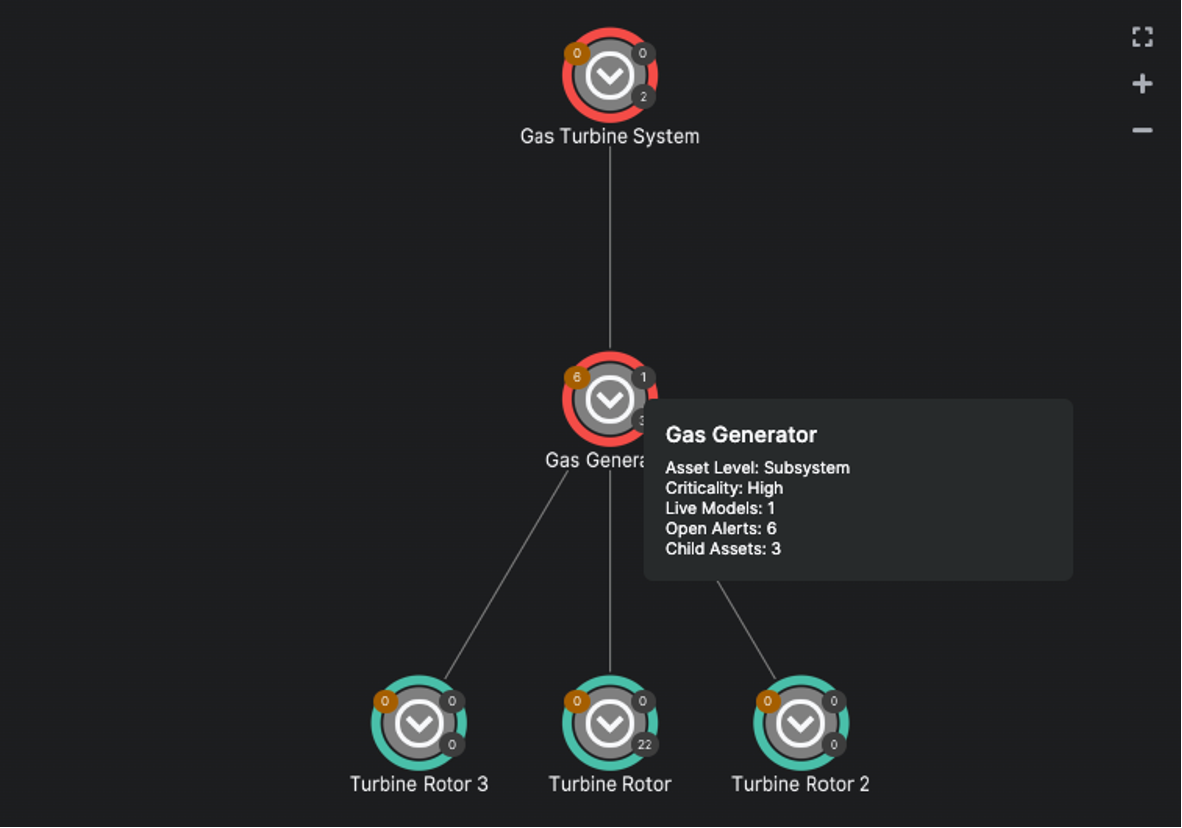
Graphic Node Display
The Graphic Node Display allows you to visualize your asset hierarchy. Hover over a node on the graph to see details about anAsset or Sensor. Right click on an Asset node to redirect to its Asset Details Page.
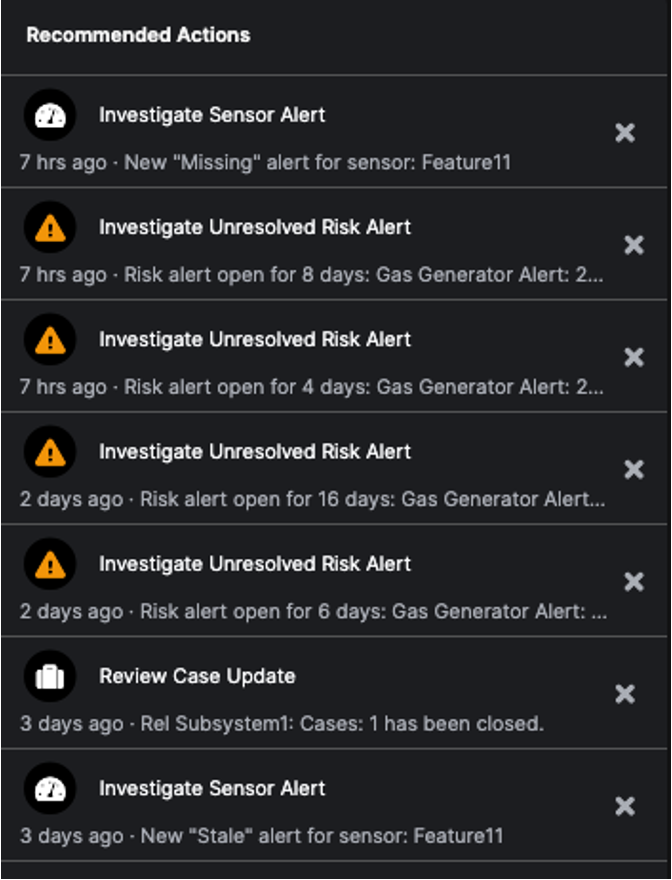
Recommended Actions
The Recommended Actions section lists openSensor Alerts, Asset Alerts, or Cases. Clicking on any item will redirect to the Details Page for that item.
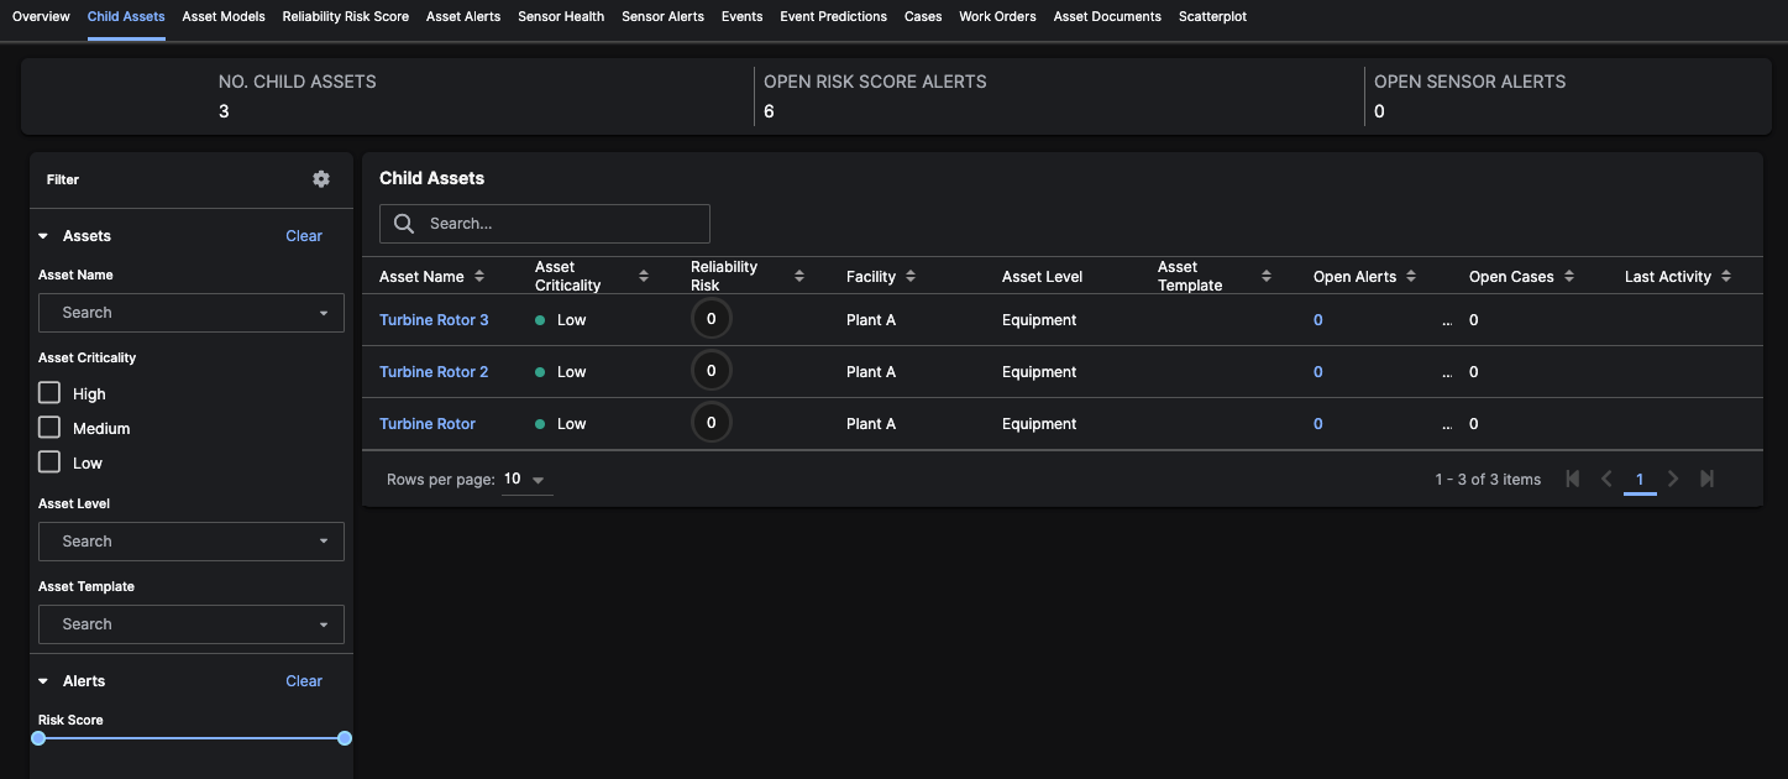
Child Assets Tab
The Child Assets tab allows you to look at the data for child assets that are related to theAsset. Clicking on the child Asset Name redirects to the Asset Detail Page for the child Asset. Clicking on the Open Alerts opens a side panel to show open Alerts for that child Asset.
Asset Models Tab
The Asset Models tab shows all of theCHAMPION models associated with the asset.
It has three main sections:
- Asset Models Overview
- Features Grid
- Model Output
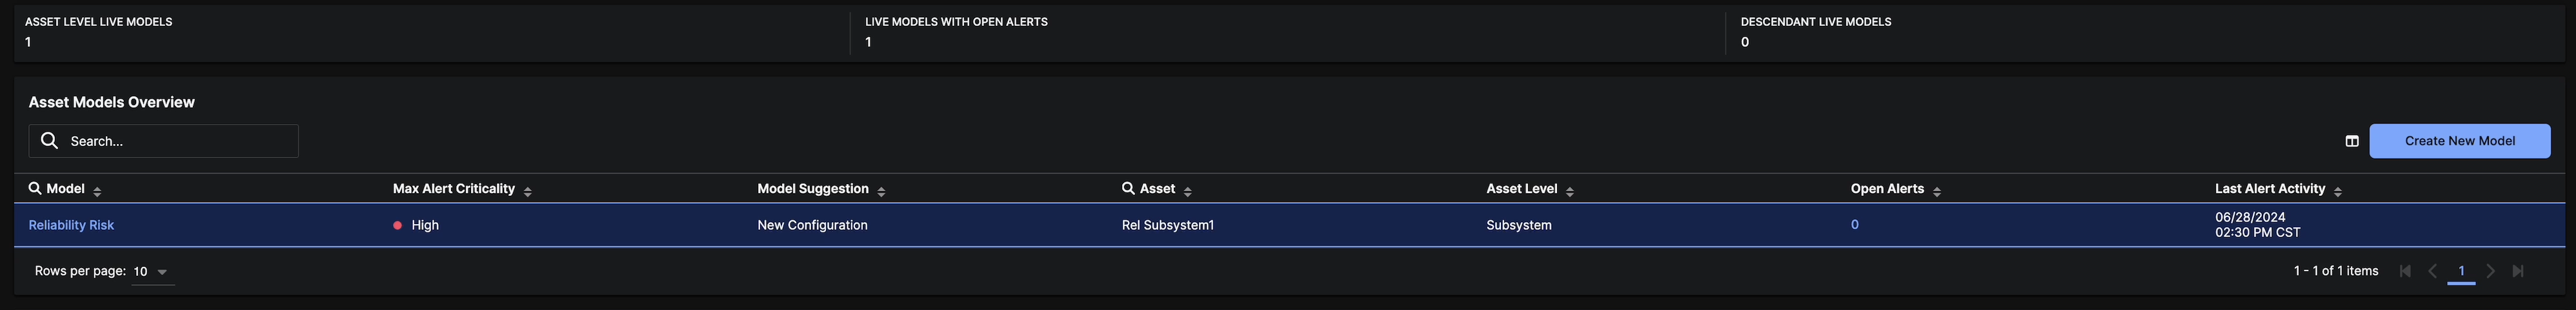
Asset Models Overview
TheAsset Models Overview Grid displays all the live models for the asset. It has 7 columns: Model, Max Alert Criticality,Model Suggestion, Asset, Asset Level, Open Alerts and Last Alert Activity. Clicking on the Model name redirects you to the Models Details Page. Clicking on the Open Alerts opens a side panel to show open Alerts for that Model. In addition, the grid contains two action buttons: one for editing the columns in the grid (represented by a grid icon) and a Create New Model blue button that redirects you to the Model Setup page for the specific Asset.
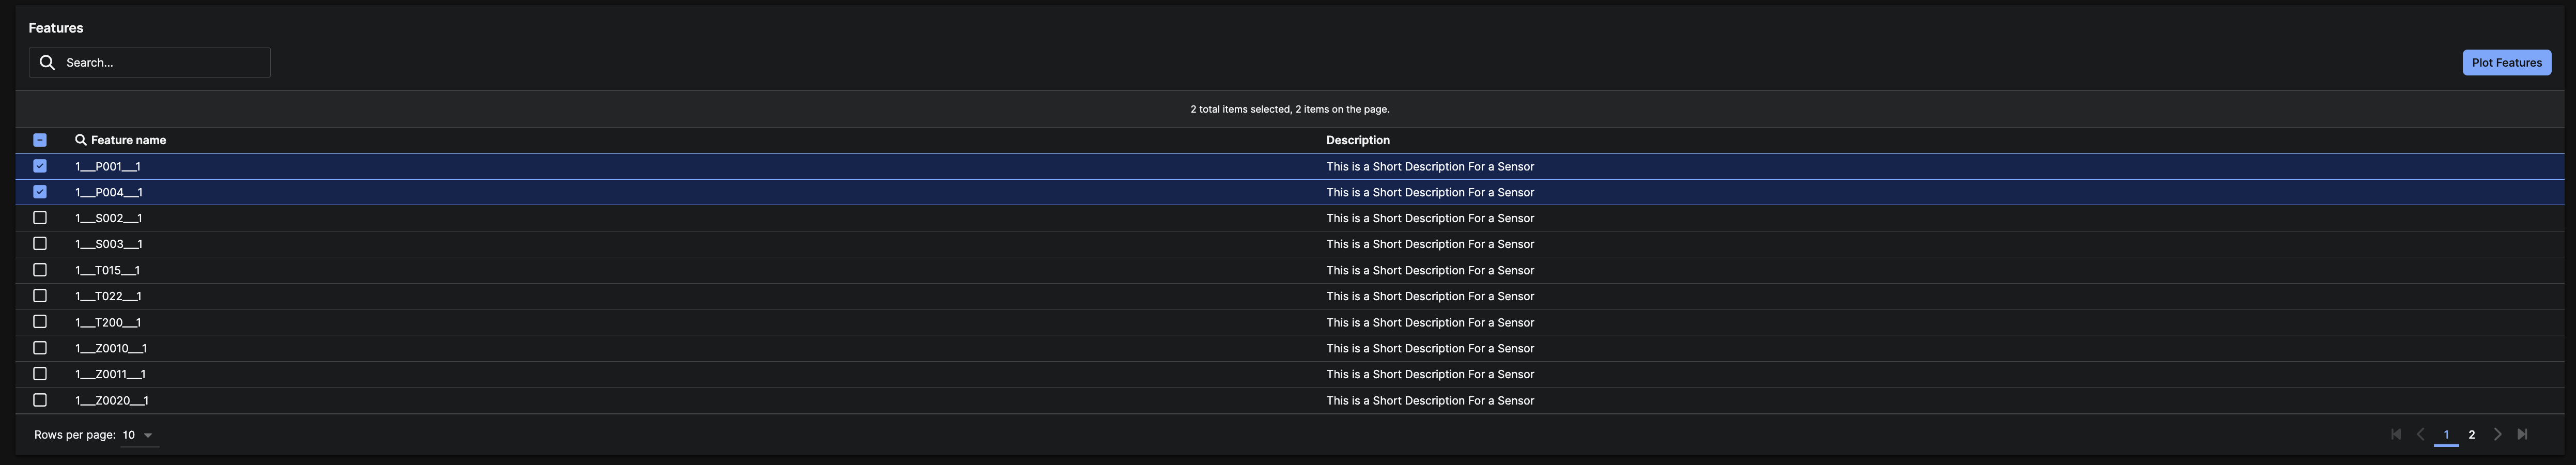
Features Grid
The Features Grid will be empty until a model is selected from theAsset Model Overview Grid. You can select a model from the Asset Model Overview grid by clicking on the eye icon on the model’s row. Once a model is selected, you can view all of the features from the model. You can also use the checkboxes to select features and click the Plot Features button to plot the selected features on the Model Output Chart below.
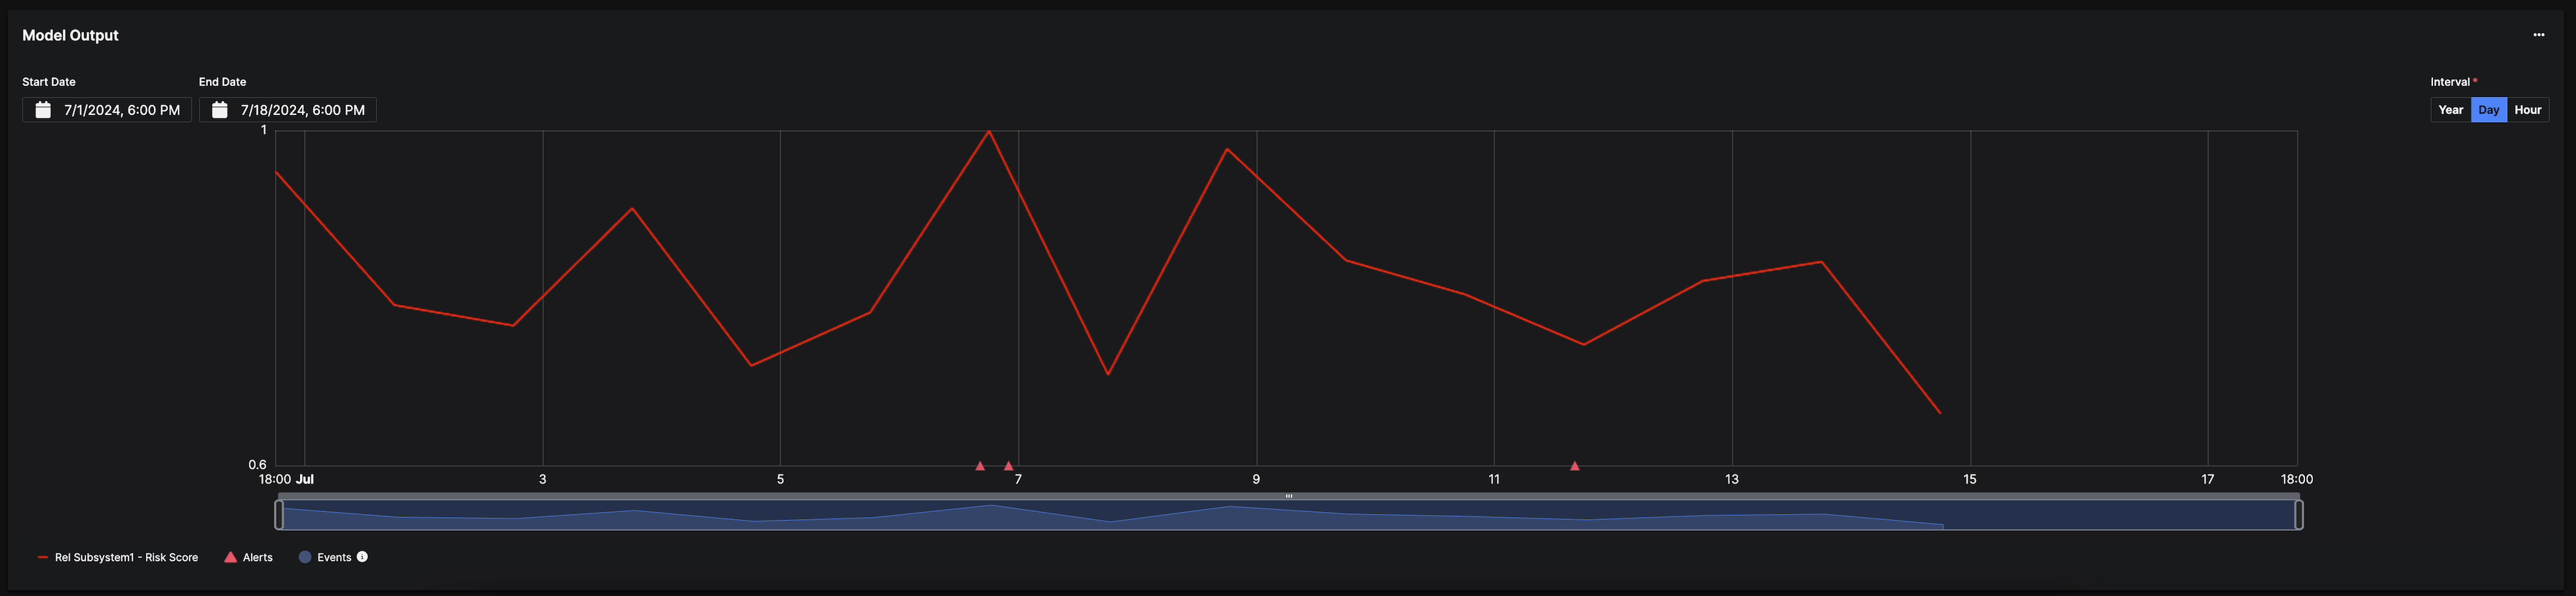
Model Output Chart
The Model Output Chart is also empty until a model is selected from theAsset Model Overview Grid. When a model is selected, the chart will plot the Model Output (for example, the Risk Score for Reliability Risk models).
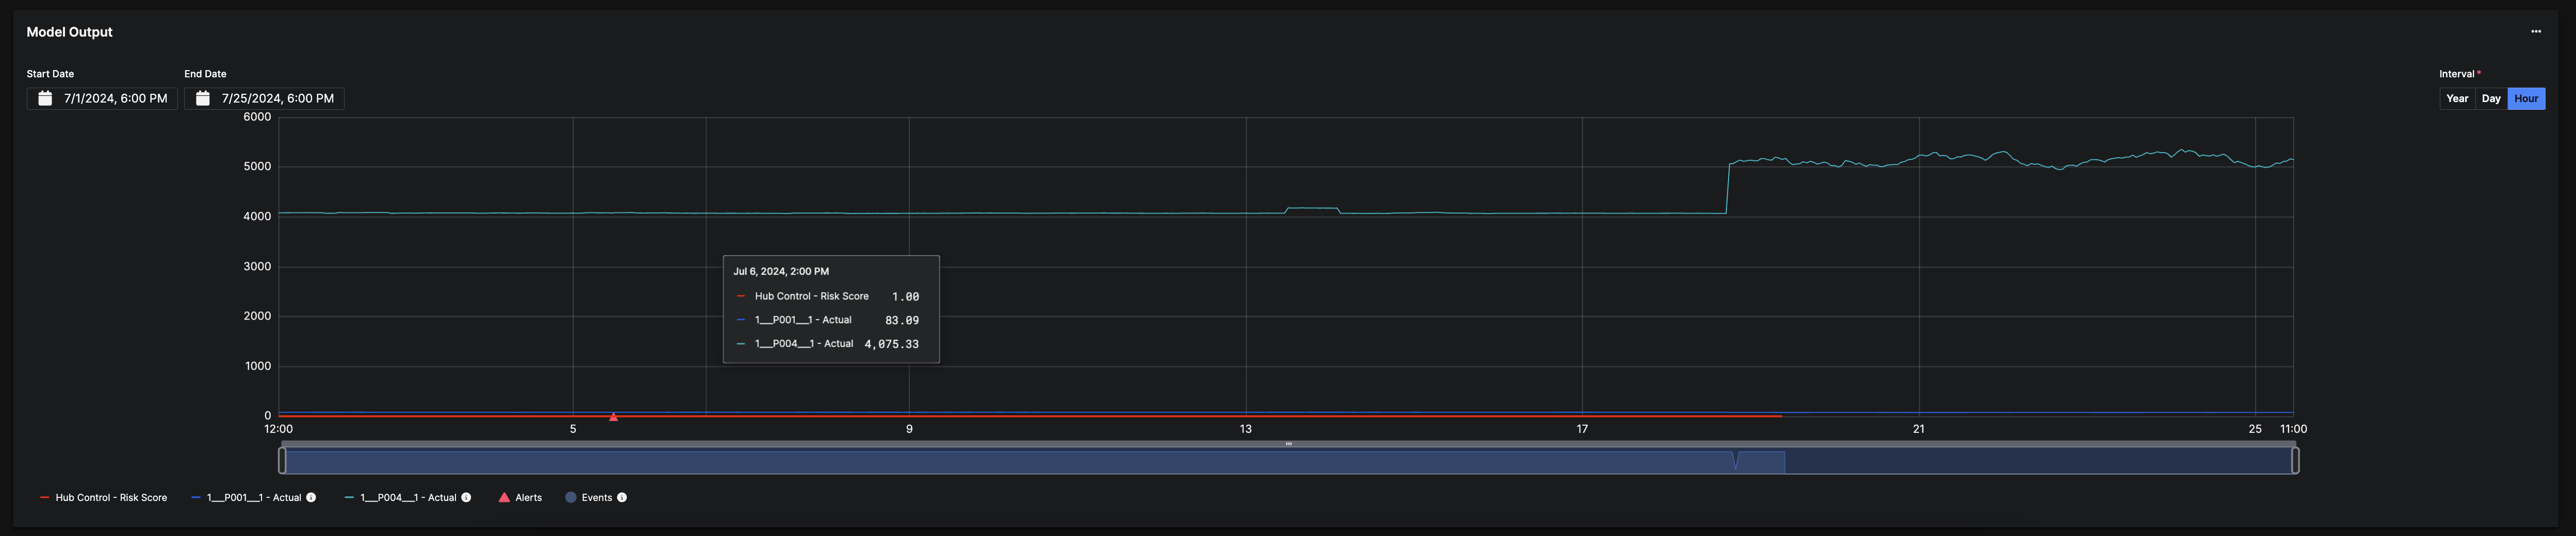
When the
Plot Features button is selected on the Features grid, the Model Output in addition to the corresponding selected features are plotted.
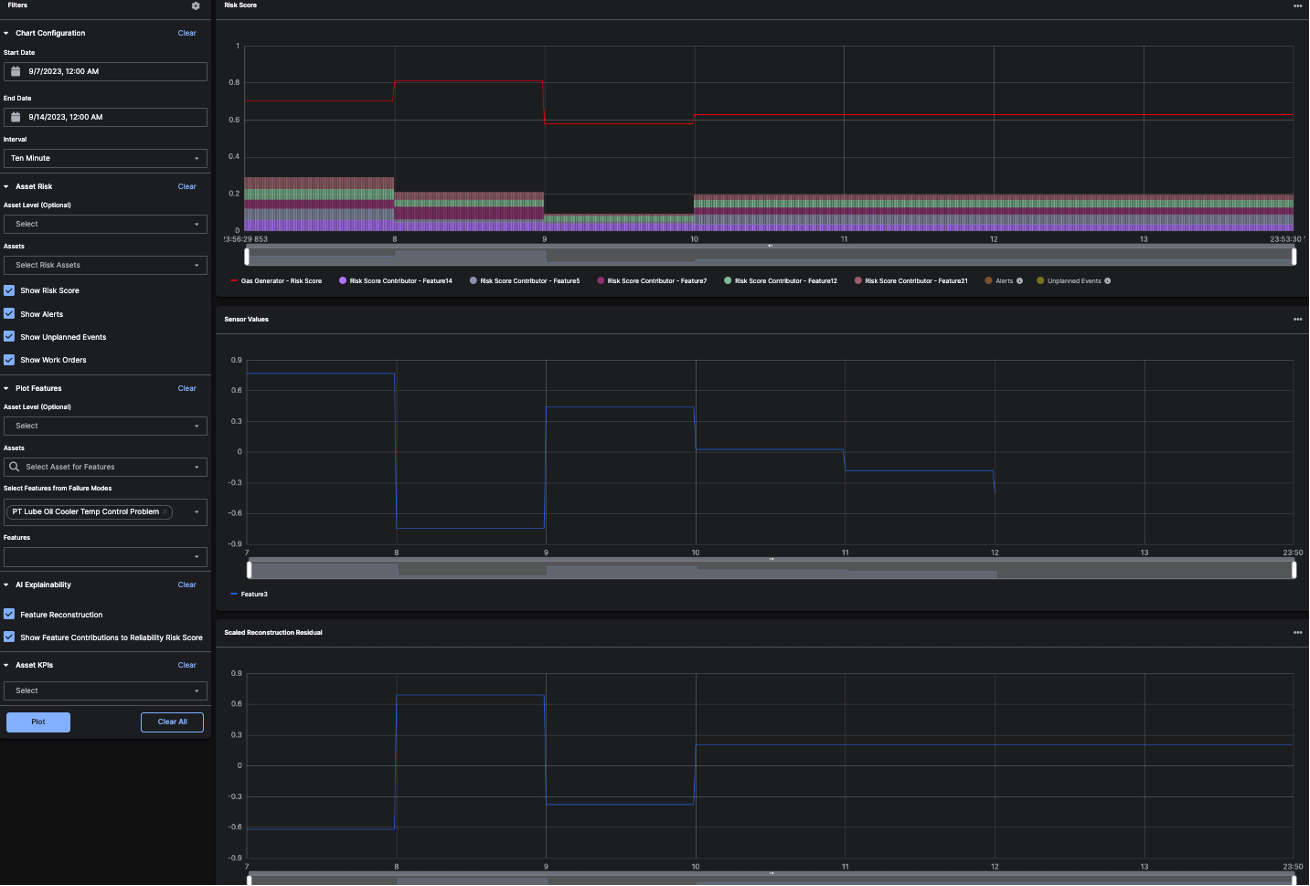
Reliability Risk Score Tab
The Reliability Risk Score tab includes a ranked and weighted display of feature contributions (contributing sensors) derived from a machine learning model over time. This asset risk score is a measure of the anomaly score for an asset. In other words, the more anomalies (irregular data) that are measuring within an asset, the higher the risk score - or risk of failure. It also includes a list of all AI Alerts that have been triggered by the Reliability Risk Model. Clicking on theAlert Name redirects to the Alert Details Page.
 To learn more about how the Reliability Risk Score Alerts are calculated, see the Alert Calculations section of the C3 AI Reliability Developer’s Guide.
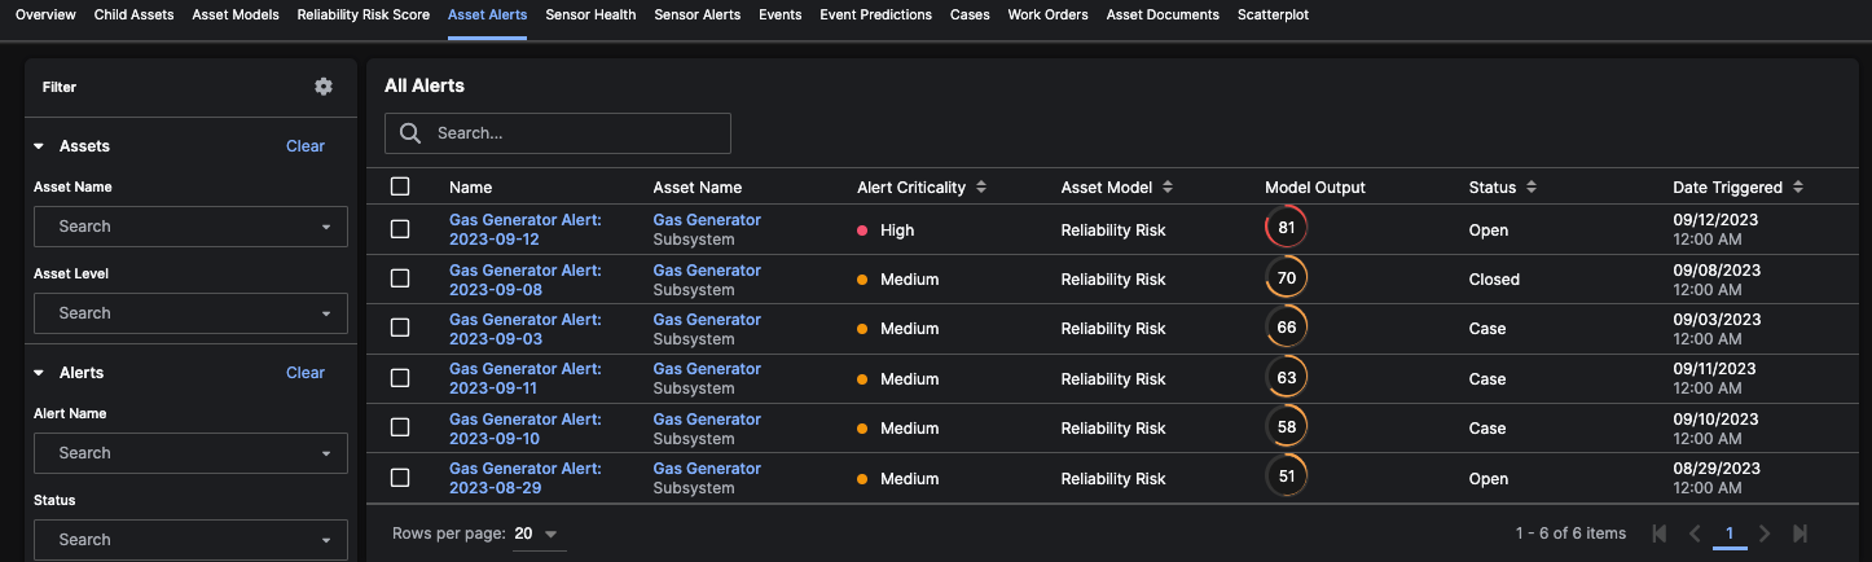
Asset Alerts Tab
The Asset Alerts tab contains a list of allAlerts that were triggered by Asset Models for the Asset. Clicking on the Alert Name redirects to the Alert Details Page. On this tab, you can triage Alerts for the Asset by sorting by Alert Criticality or Date Triggered. This allows you to efficiently address the most urgent Alerts even if there are different Model Outputs for each Asset Model.
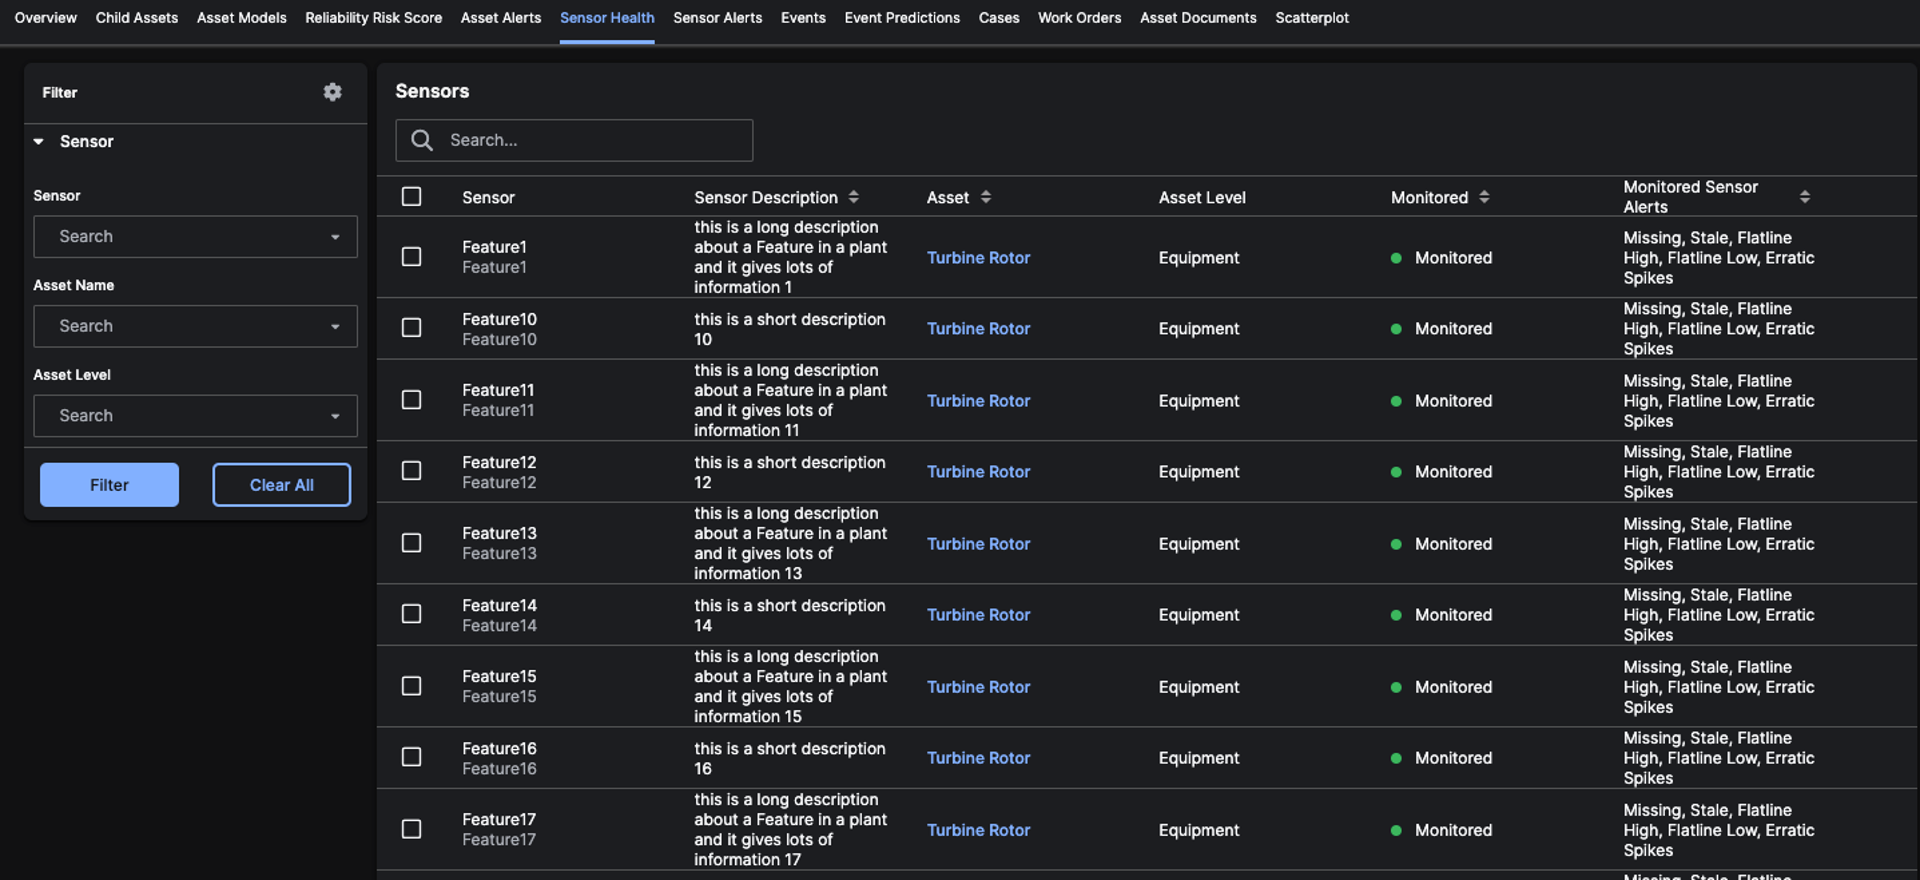
Sensor Health Tab
The Sensor Health tab to contains a list of theSensors related to the Asset, including those associated with the Child Asset. The grid table lists the Asset Level, whether the Sensor is monitored, and which Sensor Alerts are being monitored. Clicking on the Asset Name redirects to the Asset Details Page. You can also edit the Sensor and select or deselect the Sensor conditions that you want to monitor.
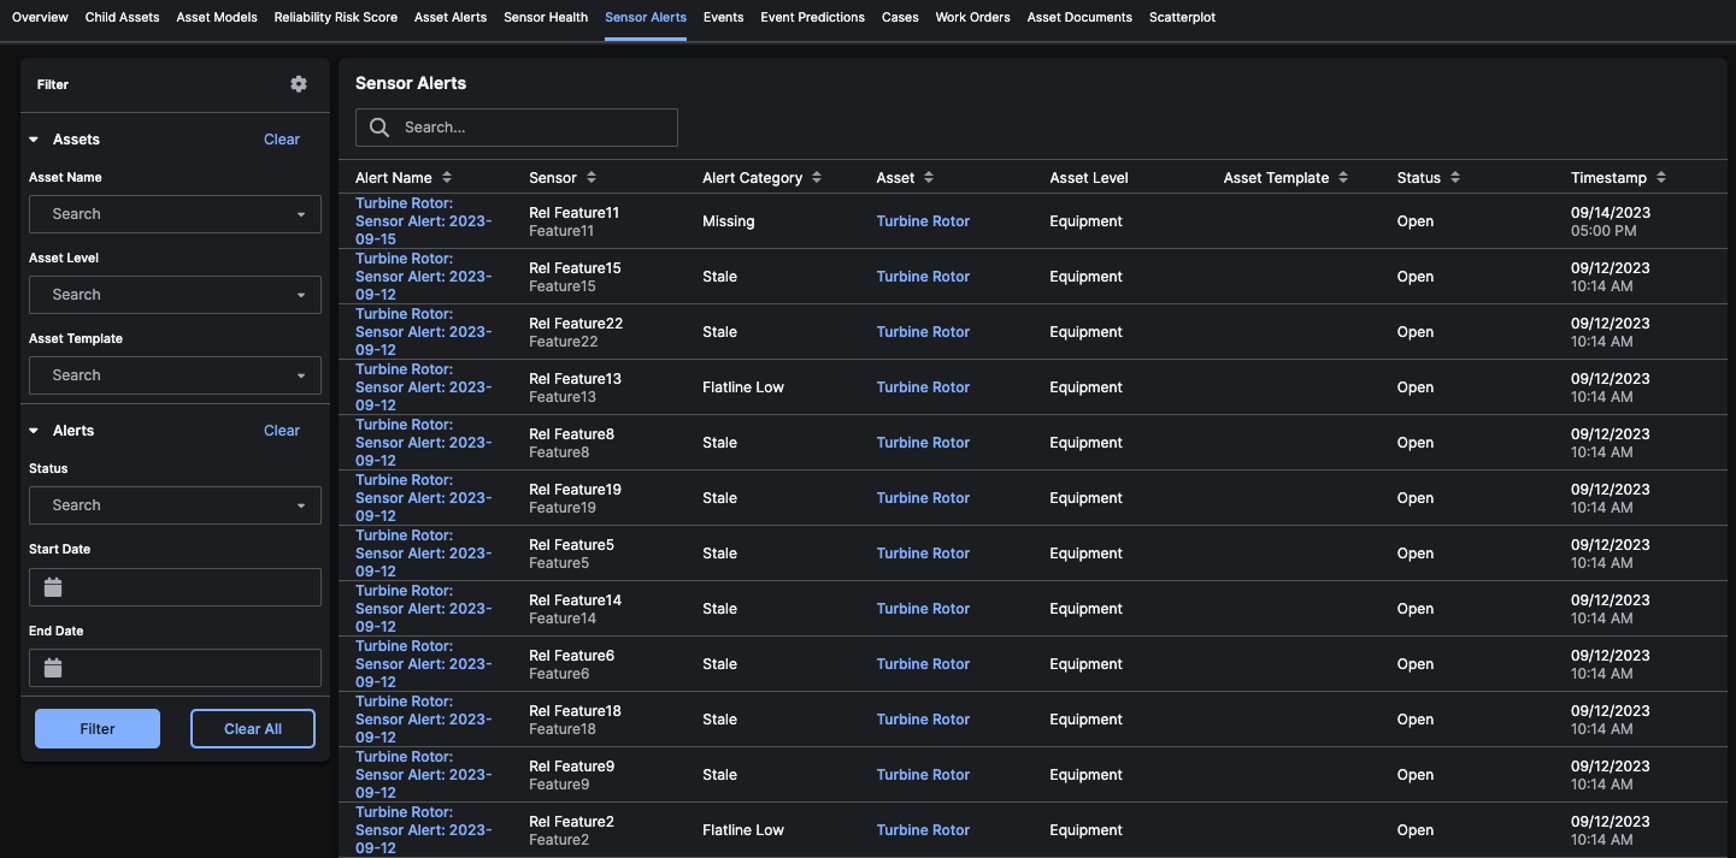
Sensor Alerts Tab
The Sensor Alerts tab contains a list of allSensor Alerts associated with the Asset. It’s a best practice to review this list periodically and close Alerts that are no longer active or that don’t have active Cases associated with them.
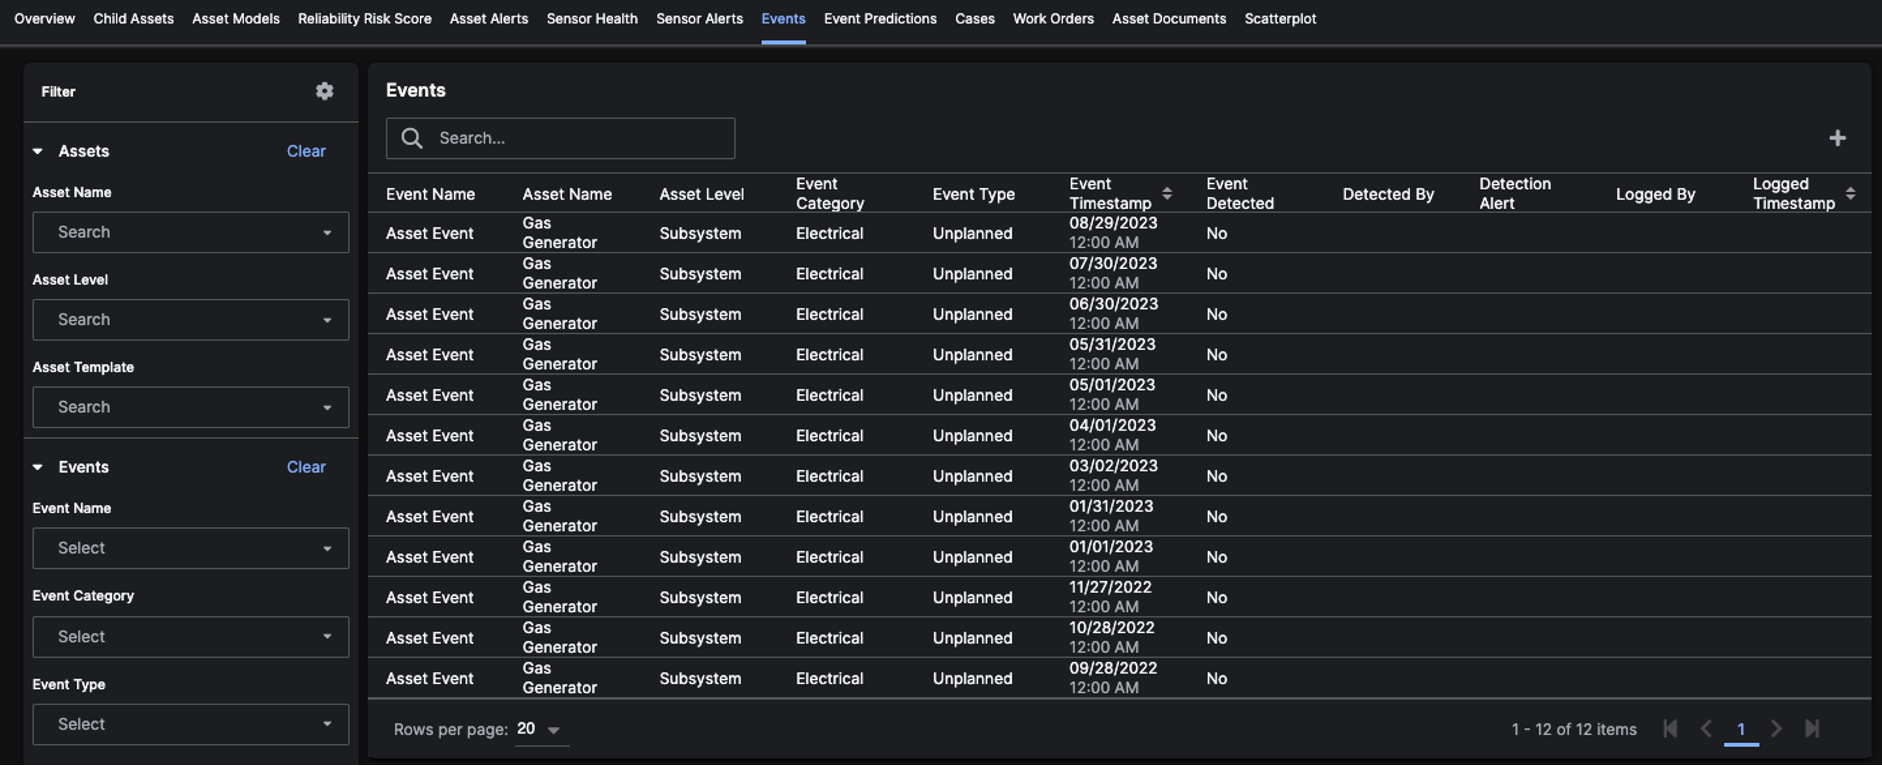
Events Tab
The Events tab contains a list of allEvents that were identified for the Asset. These Events are typically from an external data source, but they can also be added directly into the application via the add (plus) icon in the table.
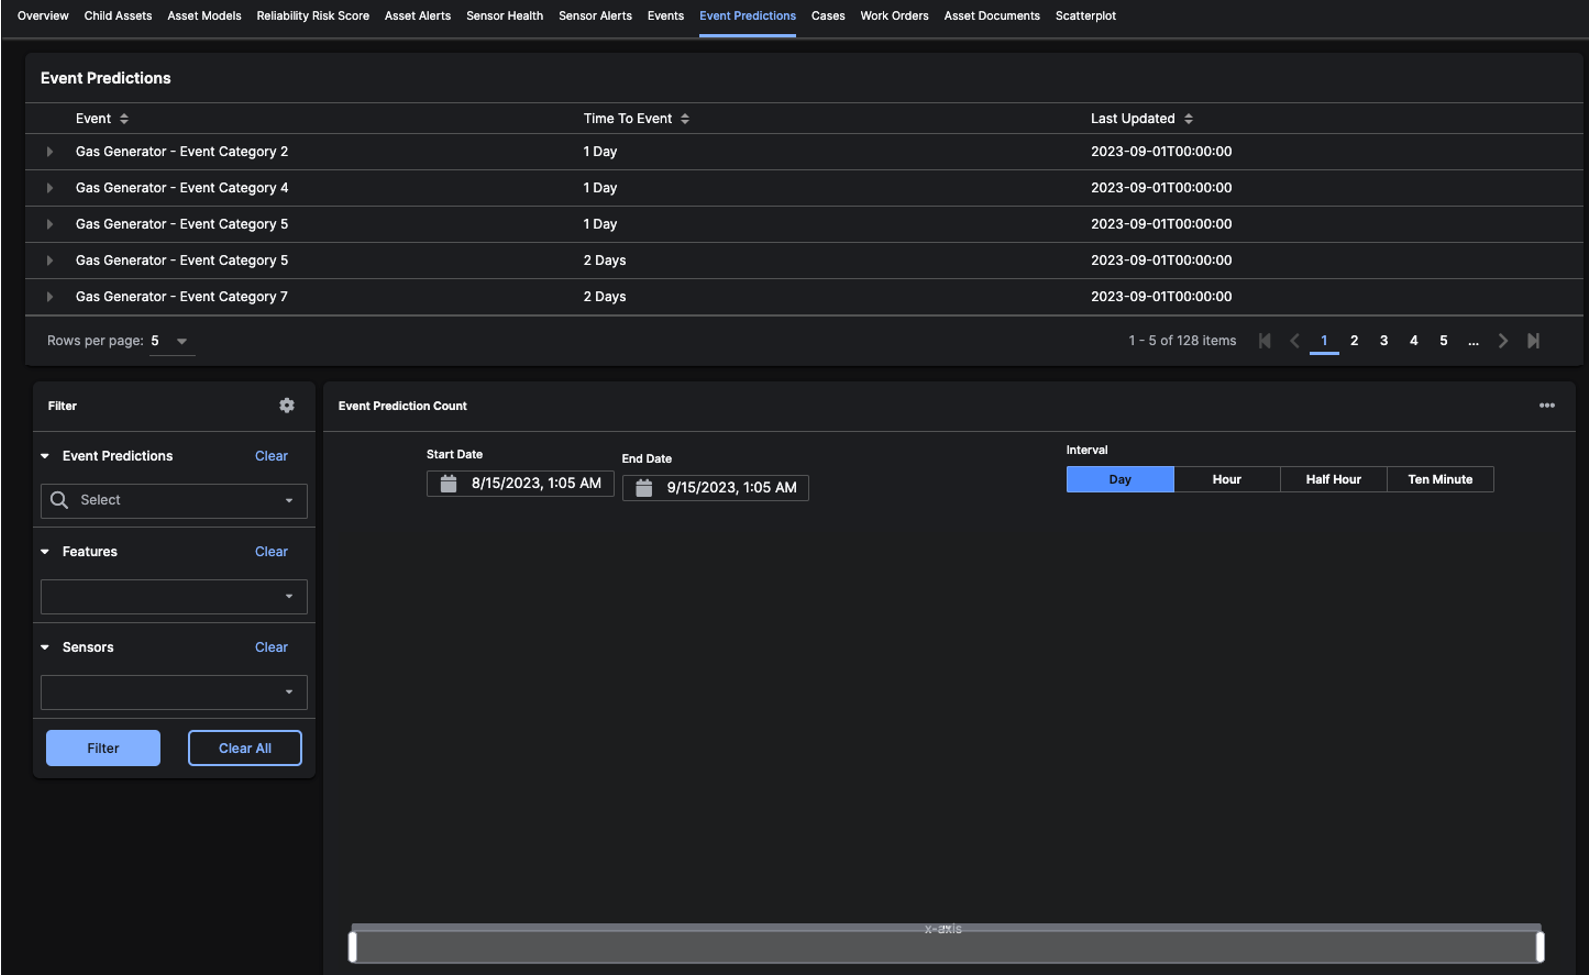
Event Predictions Tab
The Event Predictions tab contains a list ofEvent Categories associated with the Asset and its Predicted Time to Event. Expand an Event Category section to see the Sensor Name, Sensor Description, and Sensor Value associated with the Predicted Time to Event value.
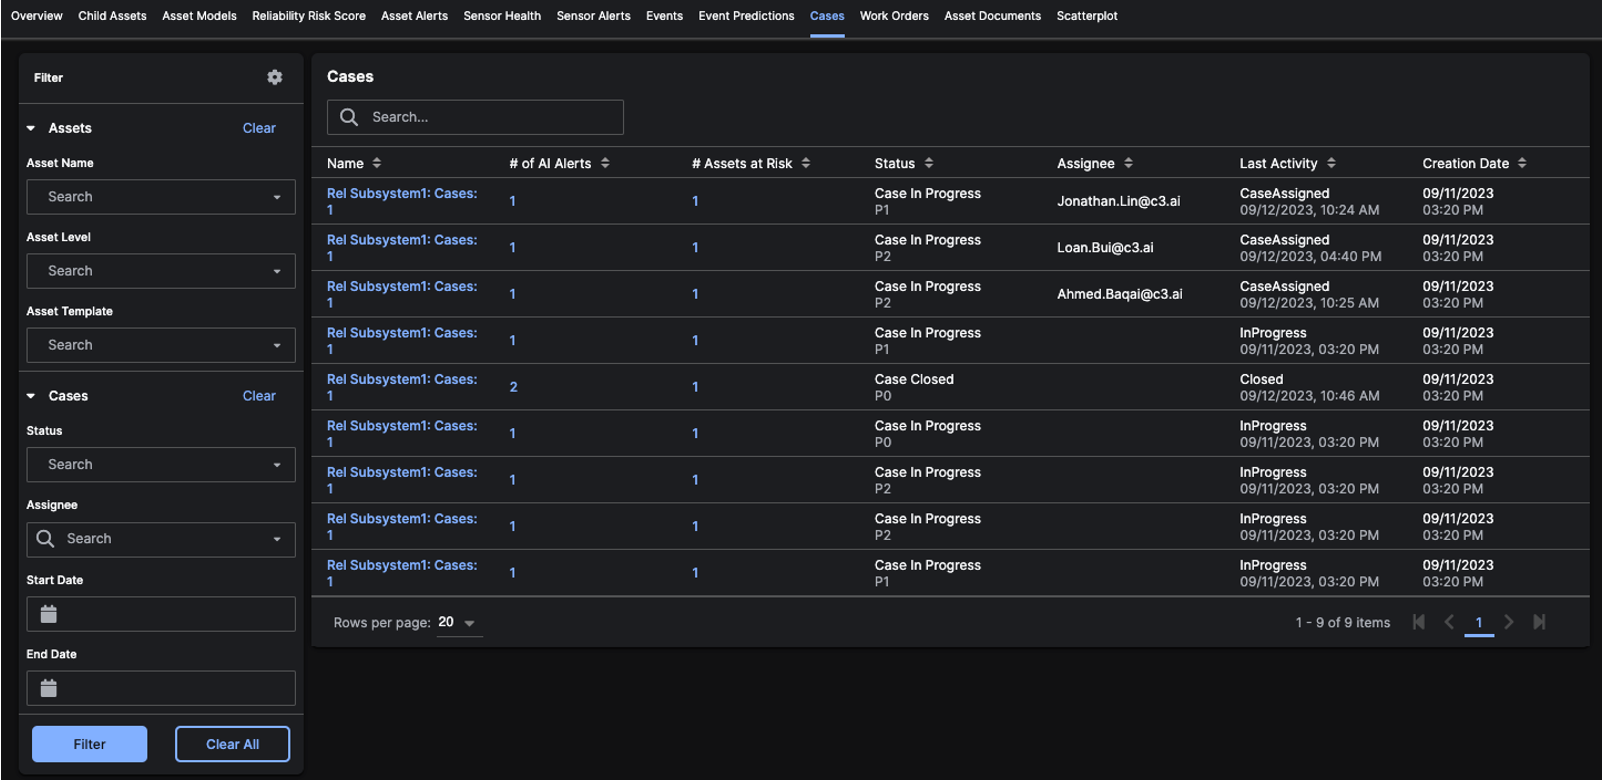
Cases Tab
The Cases tab contains a list of allCases that are associated with the Asset. Clicking on the Name redirects to the Case Details Page. Clicking on the Number of AI Alerts opens a modal listing all Alerts added to the Case. Clicking on the Number of Assets at Risk opens a modal listing all Assets associated with the Case.
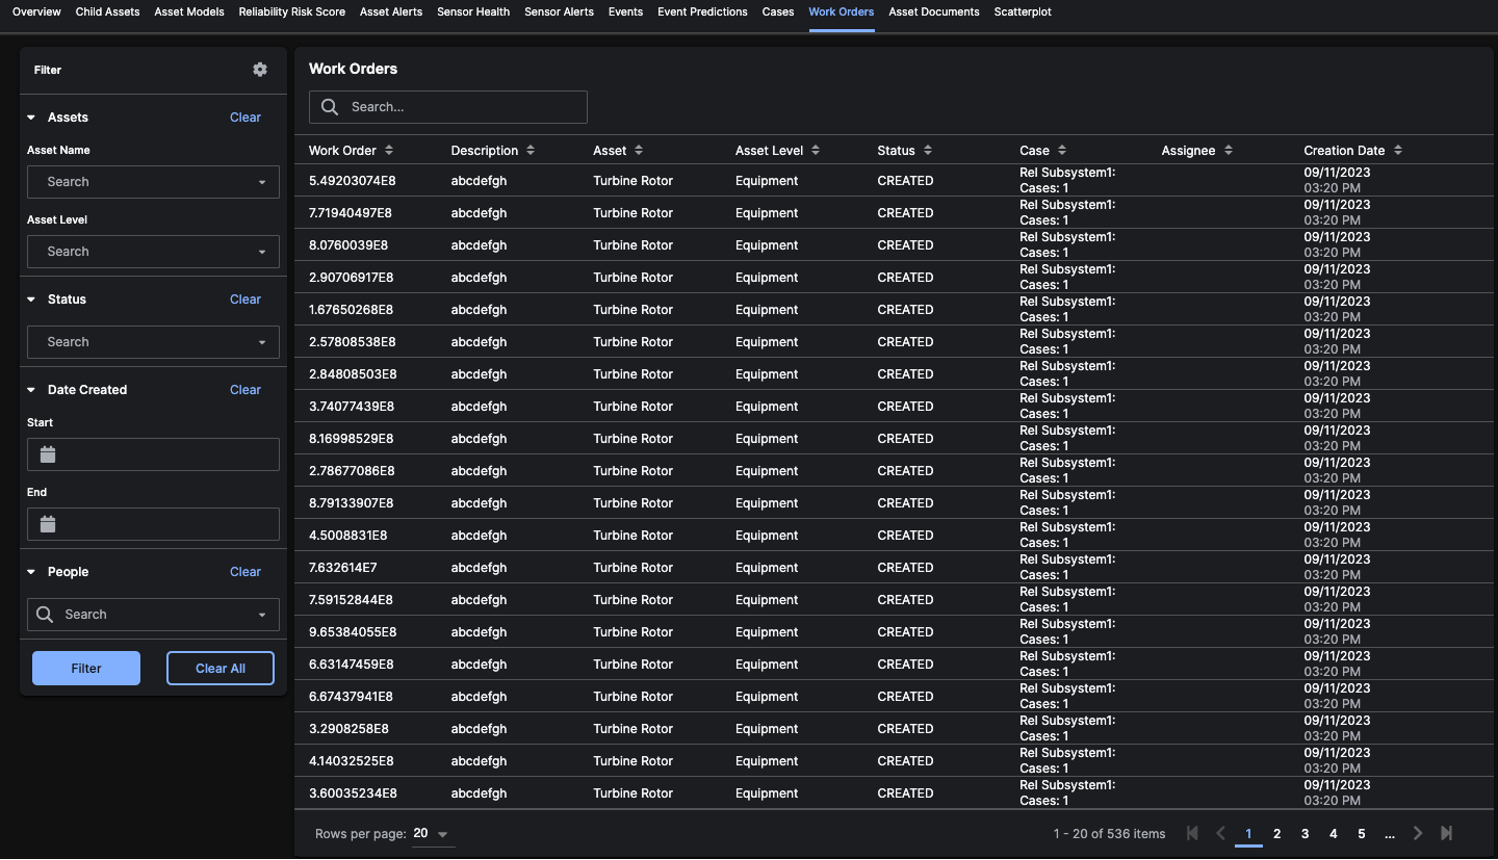
Work Orders Tab
The Work Orders tab contains a list of allWork Orders created within Cases that are associated with the Asset. It’s a best practice to review this list periodically and update the Work Order status to reflect progress activity.
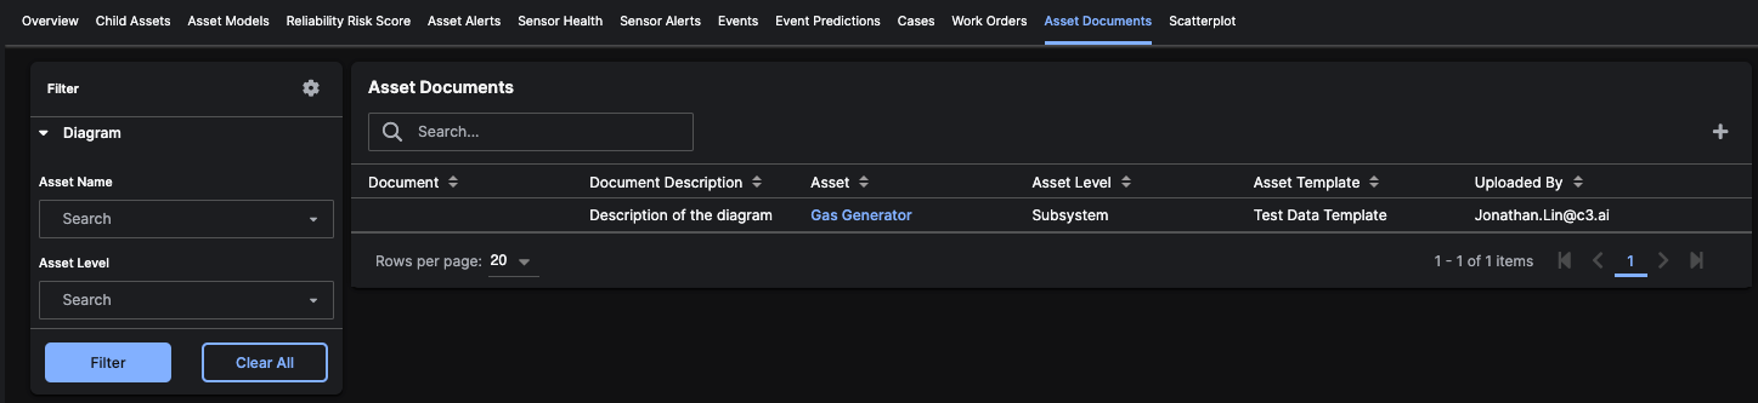
Asset Documents Tab
The Asset Documents tab contains documents that were uploaded for theAsset. When uploading a file, you are able to specify if the document should be associated with any Child Assets.
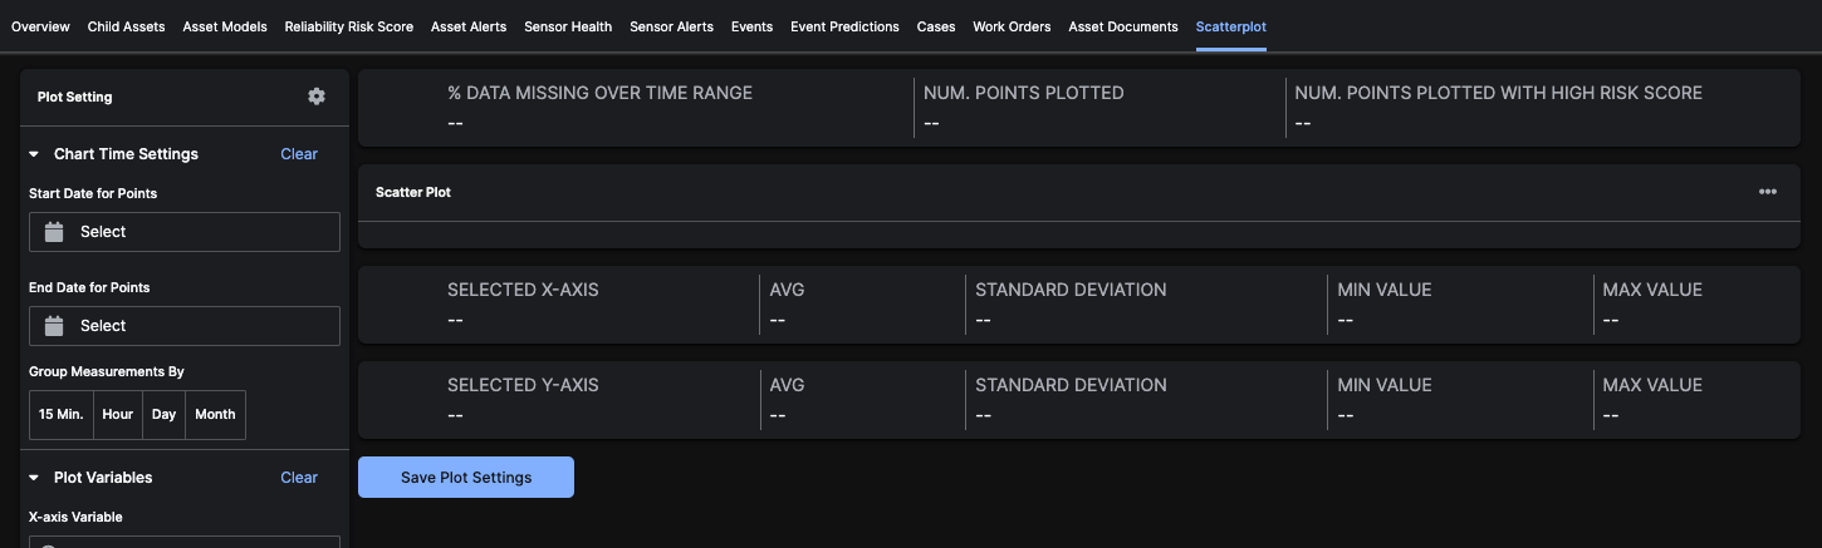
Scatter Plot Tab
The Scatter Plot tab can be used to plotFeatures from the Asset to determine if there is a correlated relationship.