The C3 AI Reliability application Overview Page (also sometimes referred to as the Home Page) is the landing page for the C3 AI Reliability application. It displays Key Performance Indicators (KPIs) for your organization across all assets and processes. The Overview Page is divided into the following sections of aggregated data:Documentation Index
Fetch the complete documentation index at: https://devdocs-shaunak-branch.mintlify.app/llms.txt
Use this file to discover all available pages before exploring further.
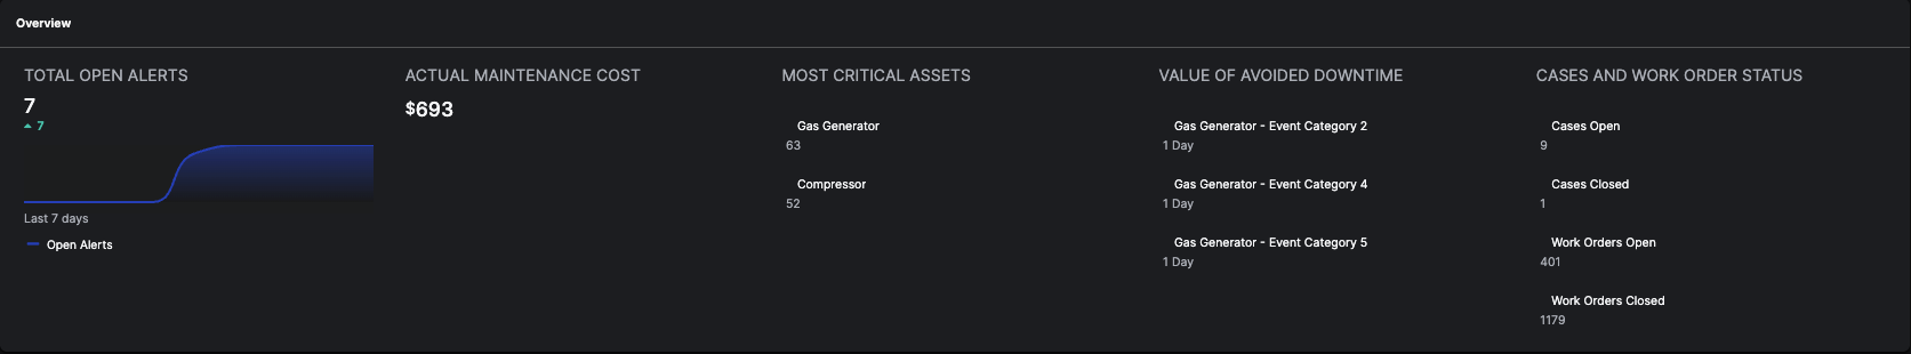
Overview Section
TheOverview section of the C3 AI Reliability application Home Page displays the the number of open alerts, aggregated maintenance costs, most critical assets, imminent events, and numbers of cases and work orders.
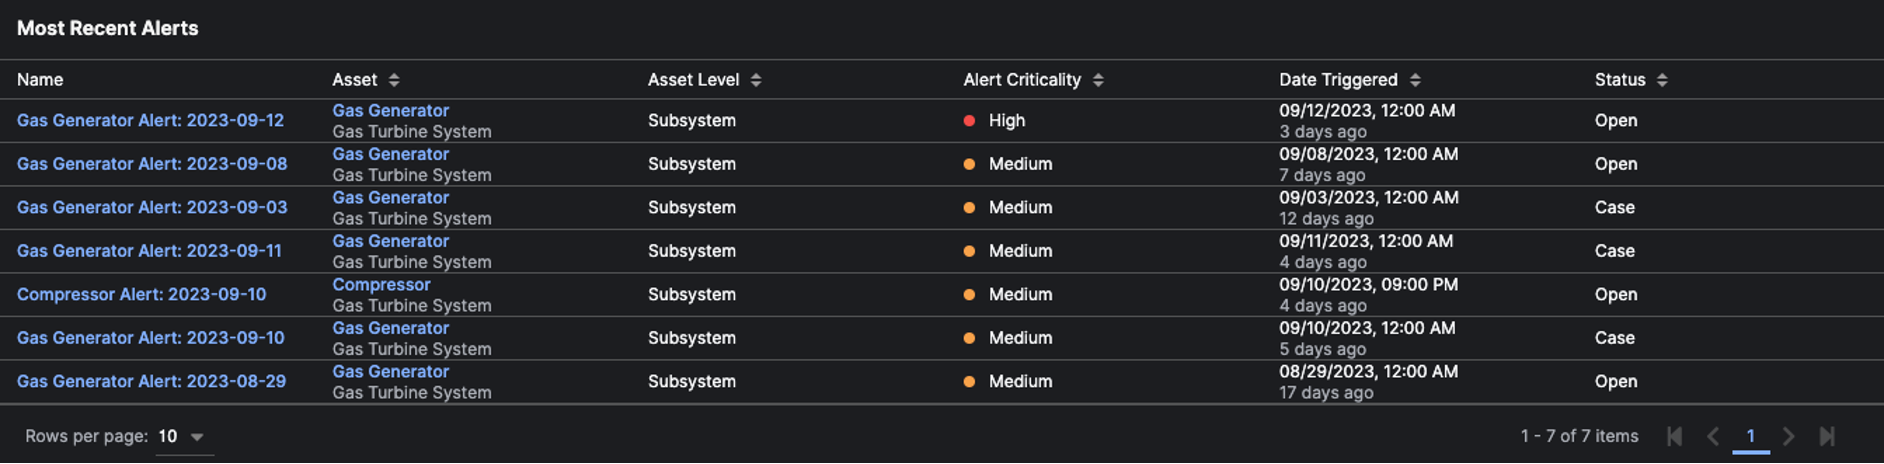
Most Recent Alerts
TheMost Recent Alerts section displays Alerts sorted by date triggered. You can click on the name of an Alert to access its Alerts Detail Page, or on the name of the associated Asset to access its Asset Detail Page.
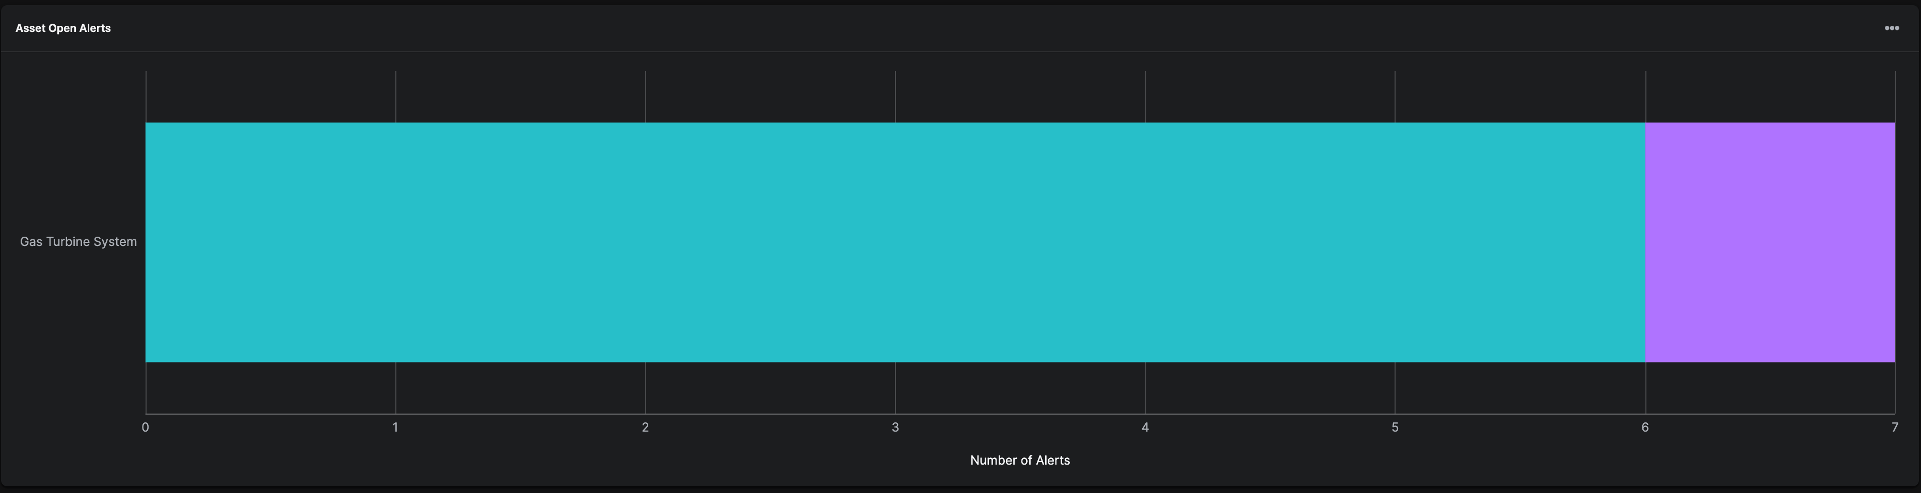
Asset Open Alerts
TheAsset Open Alerts visualization shows all of your system level Assets and the total number of open alerts for that asset and its children assets. The number of alerts are an aggregate of the number of low, medium, and high criticality alerts.
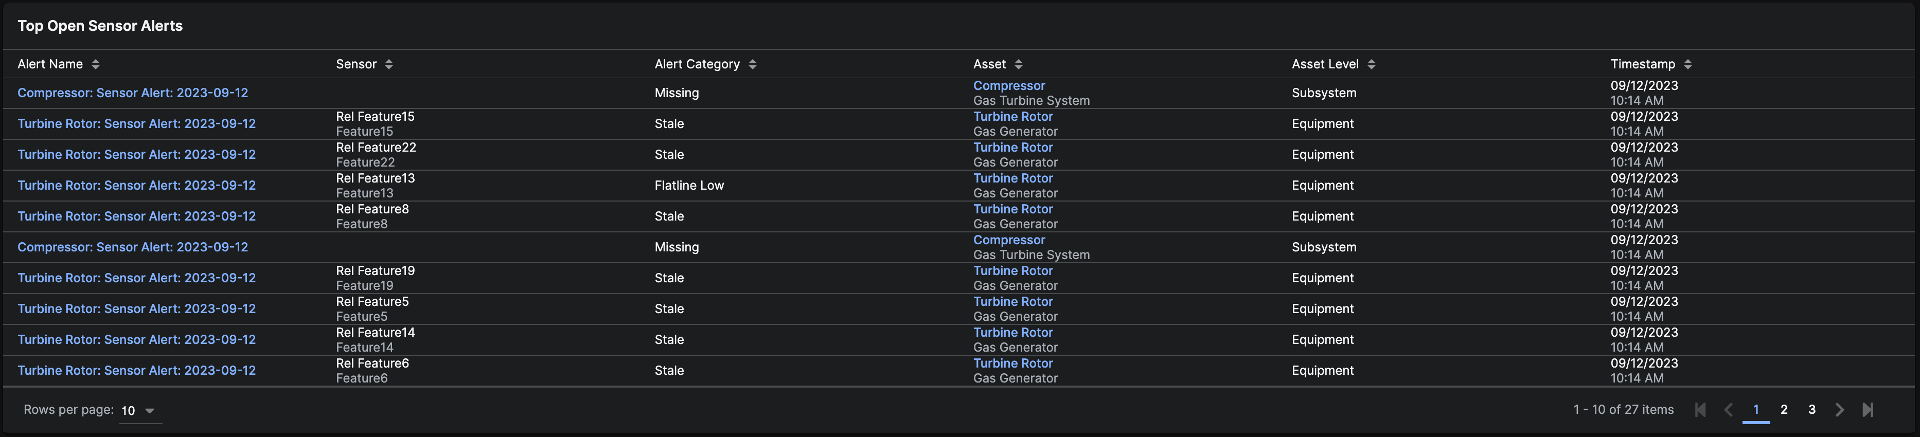
Top Open Sensor Alerts
This section displays theTop Open Sensor Alerts sorted by time.
The links in the Alert Name column take you to the Sensor Alert Details Page. You can also select the Asset related to the Sensor Alert to view the Asset Details Page.
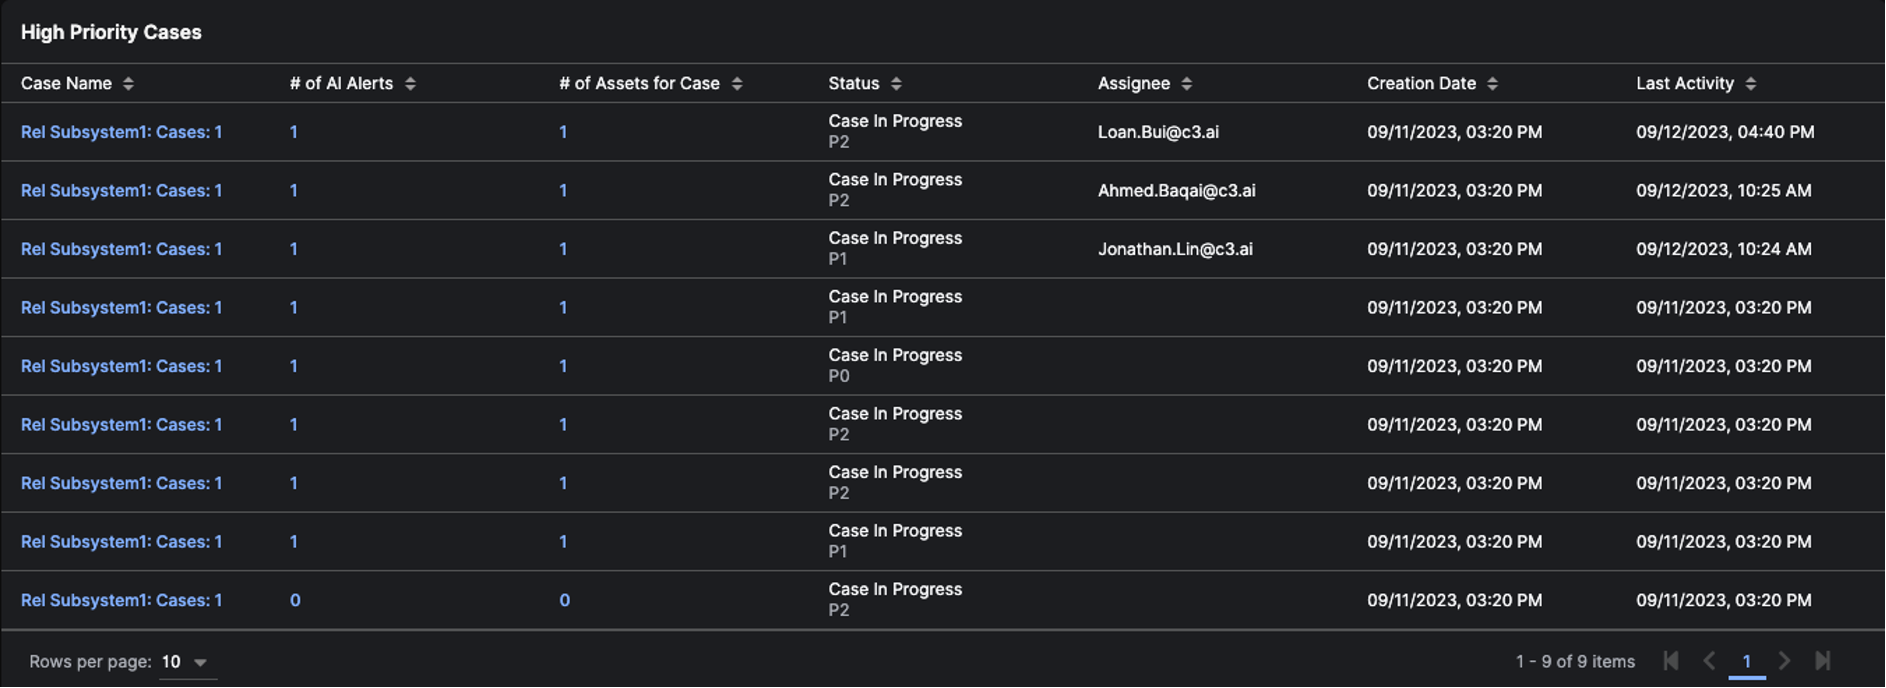
High Priority Cases
TheHigh Priority Cases section displays open or in progress Cases sorted by Last Activity date. You can select the Case name to go to the Case Detail Page. Clicking the Number of AI Alerts opens a modal that lists the Alerts that have been added to the Case. Clicking the Number of Assets for Case opens a modal that lists the Assets that have been added to the Case.
Recent Open Alerts
You can quickly access recent open alerts from anywhere in the application. You’re able to quickly triageAlerts from the side panel without leaving the page you’re currently viewing.
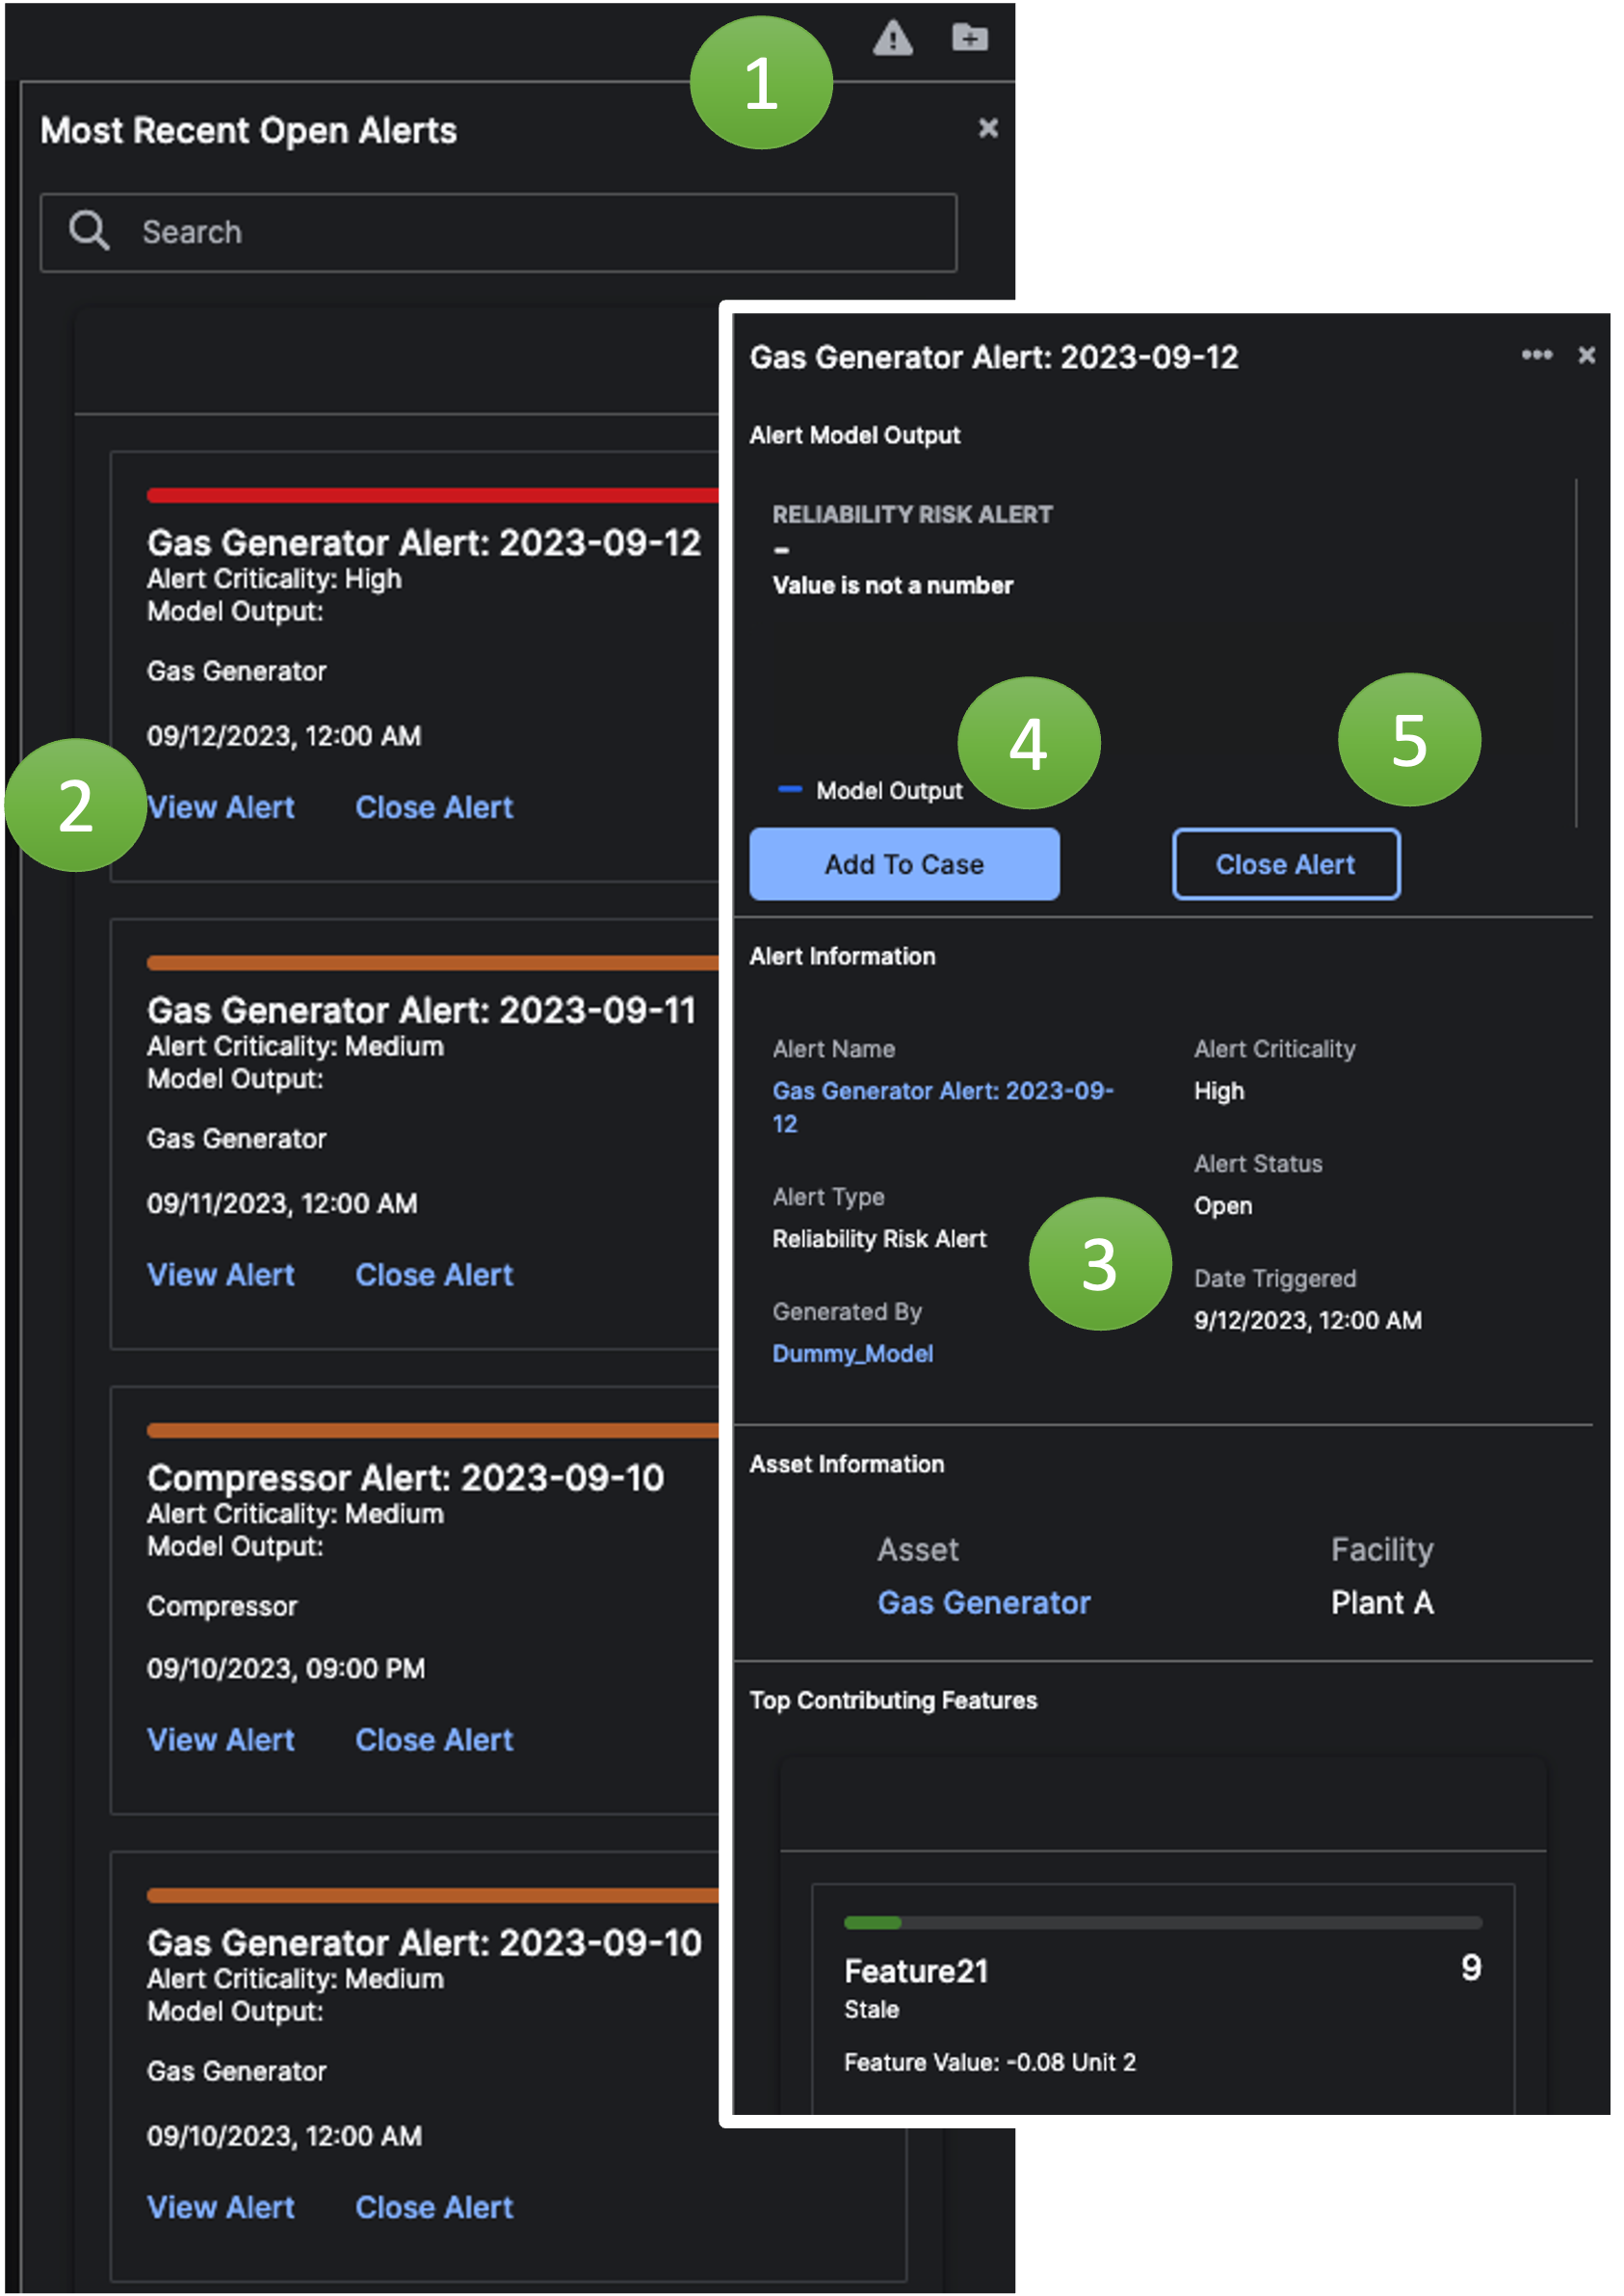
- Choose the global alert (triangle with an exclamation mark in the middle) icon to bring up a list of recent asset
Alerts. - Clicking on
View Alertshows you details of theAlertin the side panel. - Within the
Alert, you can click on theAlert Nameto go to the Alert Details Page, theModel Nameto go to the Model Details Page, or theAsset Nameto go to the Asset Details Page. - Click
Add To Caseto add theAlertto a new or existingCasefor further investigation. - Close the
Alertif it’s no longer relevant/valid.
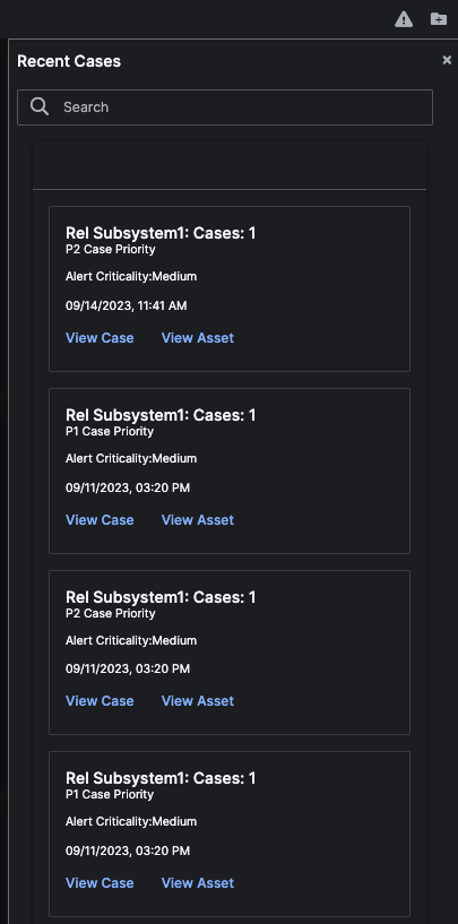
Recent Cases
You can quickly access cases with recent activity from anywhere in the application. You can clickView Case to go to the Case Details Page. You can click View Asset to go to the Asset Details Page.