Before you begin configuring your asset hierarchy, it’s important to understand what Reliability needs in order to model, monitor, and act on asset health effectively. At its core, the Reliability platform connects three things:Documentation Index
Fetch the complete documentation index at: https://devdocs-shaunak-branch.mintlify.app/llms.txt
Use this file to discover all available pages before exploring further.
- Asset structure — which assets exist, and how they relate to one another
- Sensor telemetry — what signals describe their behavior
- Failure models — how those signals indicate degradation, risk, or abnormal behavior
Understanding what you’re building
The Reliability asset hierarchy is made up of a small number of core object types that together define how the system monitors equipment and responds to potential failures.| Type | Purpose |
|---|---|
Facility | Represents a site or logical grouping of assets (e.g., wind farm, plant, building). |
ReliabilityAsset | Represents a maintainable unit of equipment (e.g., turbines, gearboxes, generators, and converters) |
Sensor | Sensors provide the raw data used by models, metrics, and alerts. |
ExpectedSensor | An abstract label (e.g., INLET_PRESSURE) that represents the intended purpose of a measurement. These enable generalization across similar assets and tie directly into model features and failure detection logic. |
AssetClass | A reusable template that defines what expected sensors and failure modes are applicable to a given kind of asset. |
FailureMode and FailureModeLibrary | Patterns of degradation or abnormal behavior that the system should detect. These are defined in terms of expected sensors and diagnostics. Libraries group them for reuse across asset classes. |
- Which assets are monitored
- What sensors they expose
- What “normal” behavior looks like
- What kinds of failures should be anticipated
- How those failures map to alerts and operational action
How configuration happens
There are multiple ways to build and populate this structure:- Through the UI: Best for exploring, validating, or refining individual facilities. Use the Asset Hierarchy Viewer and Sensor Mapping tools to interactively create and review your model.
- Through bulk upload or scripted pipelines: Preferred for production environments. Asset and sensor definitions are often staged ahead of time using spreadsheets, data integration flows, or preloading scripts. These methods allow you to define expected sensors, failure modes, bounds, and tags at scale.
- Creating a facility
- Building an asset structure under that facility
- Assigning classes that determine diagnostics
- Attaching and aligning sensors
- Reviewing the hierarchy for completeness and telemetry readiness
Prerequisites
Before you begin, confirm the following:- Asset classes are available: Your environment includes the necessary
AssetClassdefinitions with their associatedExpectedSensorandFailureModeLibraryentries. If not, request that these be imported or configured by your admin team. - Expected sensors are defined: Each sensor to be mapped must correspond to a defined
ExpectedSensor. These are required for ML models and alert logic, and must follow platform conventions (e.g., no spaces, alphanumeric names). - (Optional) P&ID diagrams are parsed: If you’re using piping and instrumentation diagrams to support sensor mapping, make sure the diagrams have been uploaded and parsed in advance.
- You will also want to make sure you have all the necessary permissions and environment settings to access the UI. You can check that you meet the requirements laid out [here]](../../prerequisites).
Build using the UI
Step 1: create a facility
Go to Config → Facility Management or open the Asset Hierarchy Table.Click
Add Facility, enter a name (e.g., “North Wind Farm”), and save.The facility will appear in both the table and graph view of the Asset Hierarchy Viewer.
Step 2: add and structure assets
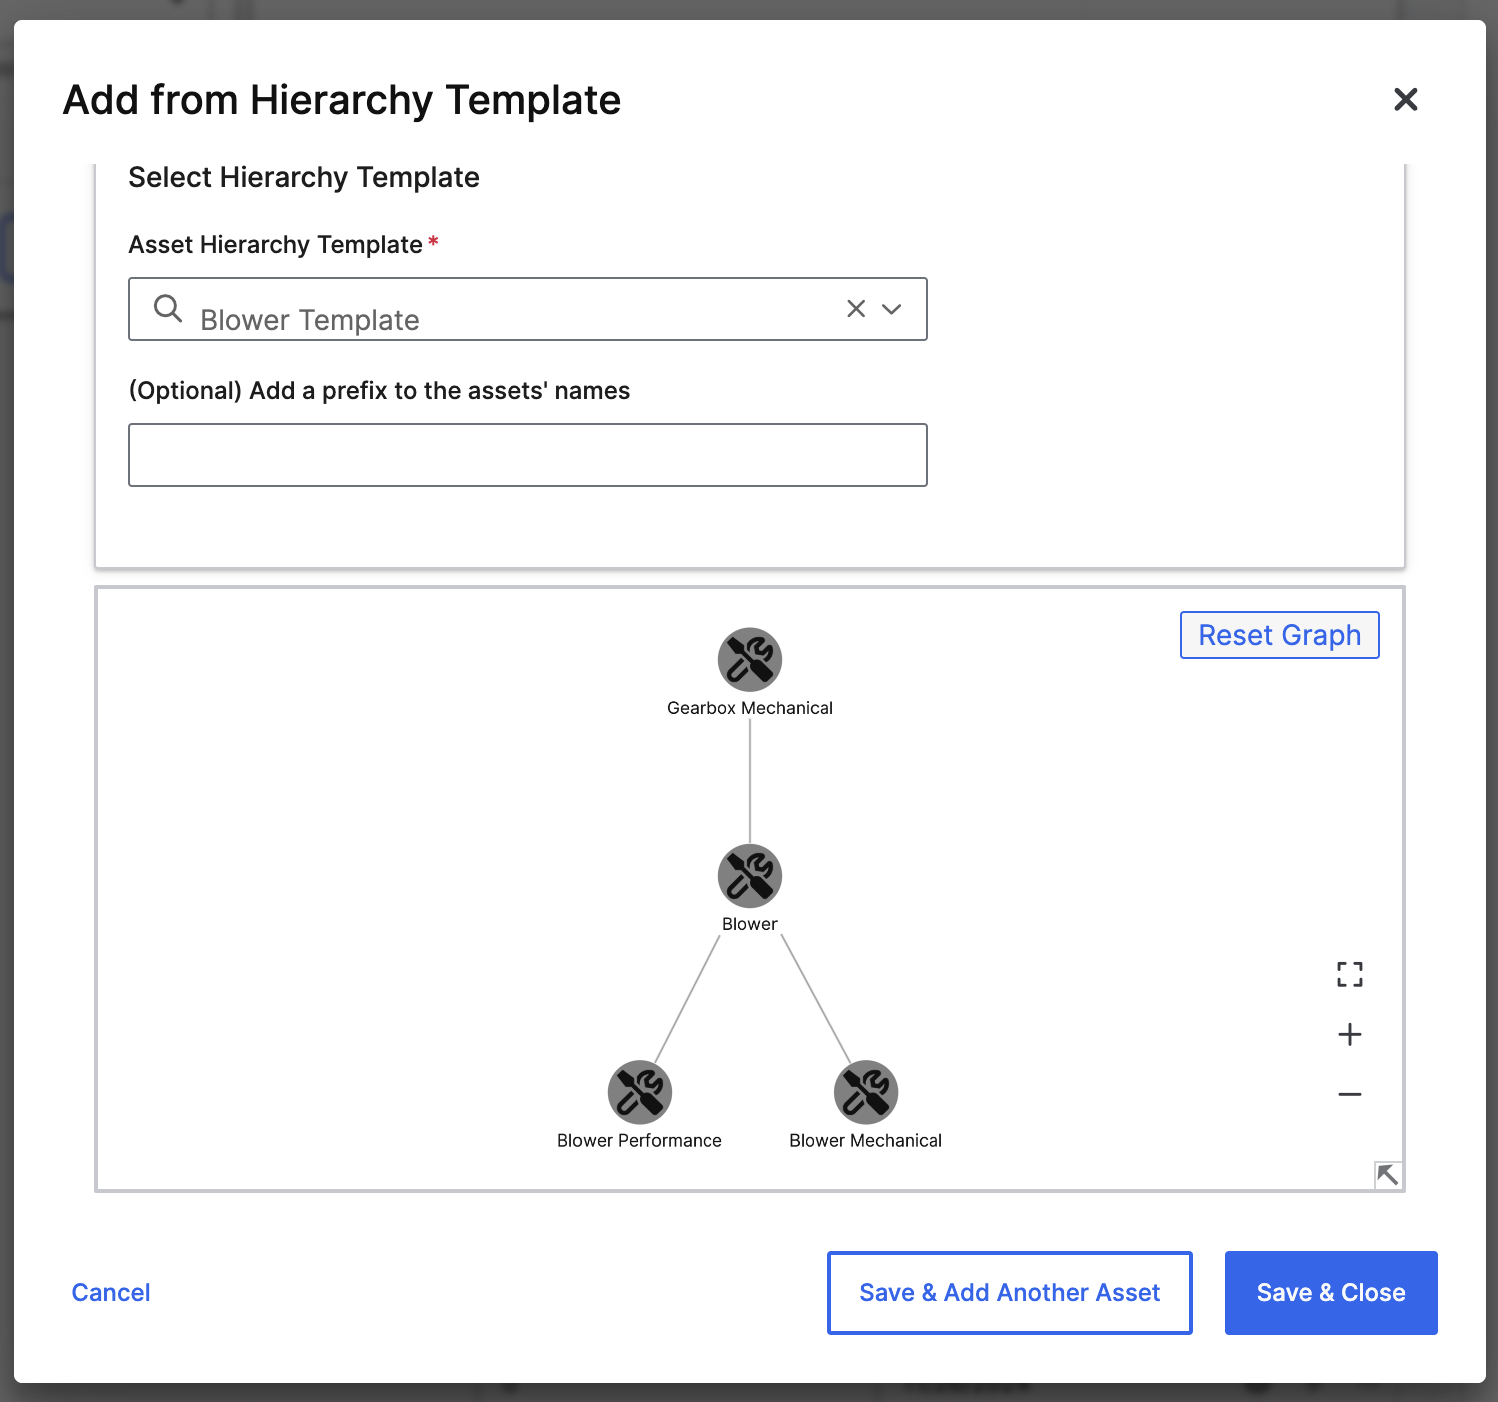
You can add assets from scratch, from prebuilt templates, or by selecting an asset class.Add from hierarchy template
Templates let you instantiate a predefined tree of assets with known classes and relationships.- Select a facility or parent asset in the graph.
- Click
Add from Hierarchy Template. - Choose a template, preview the structure, and save.
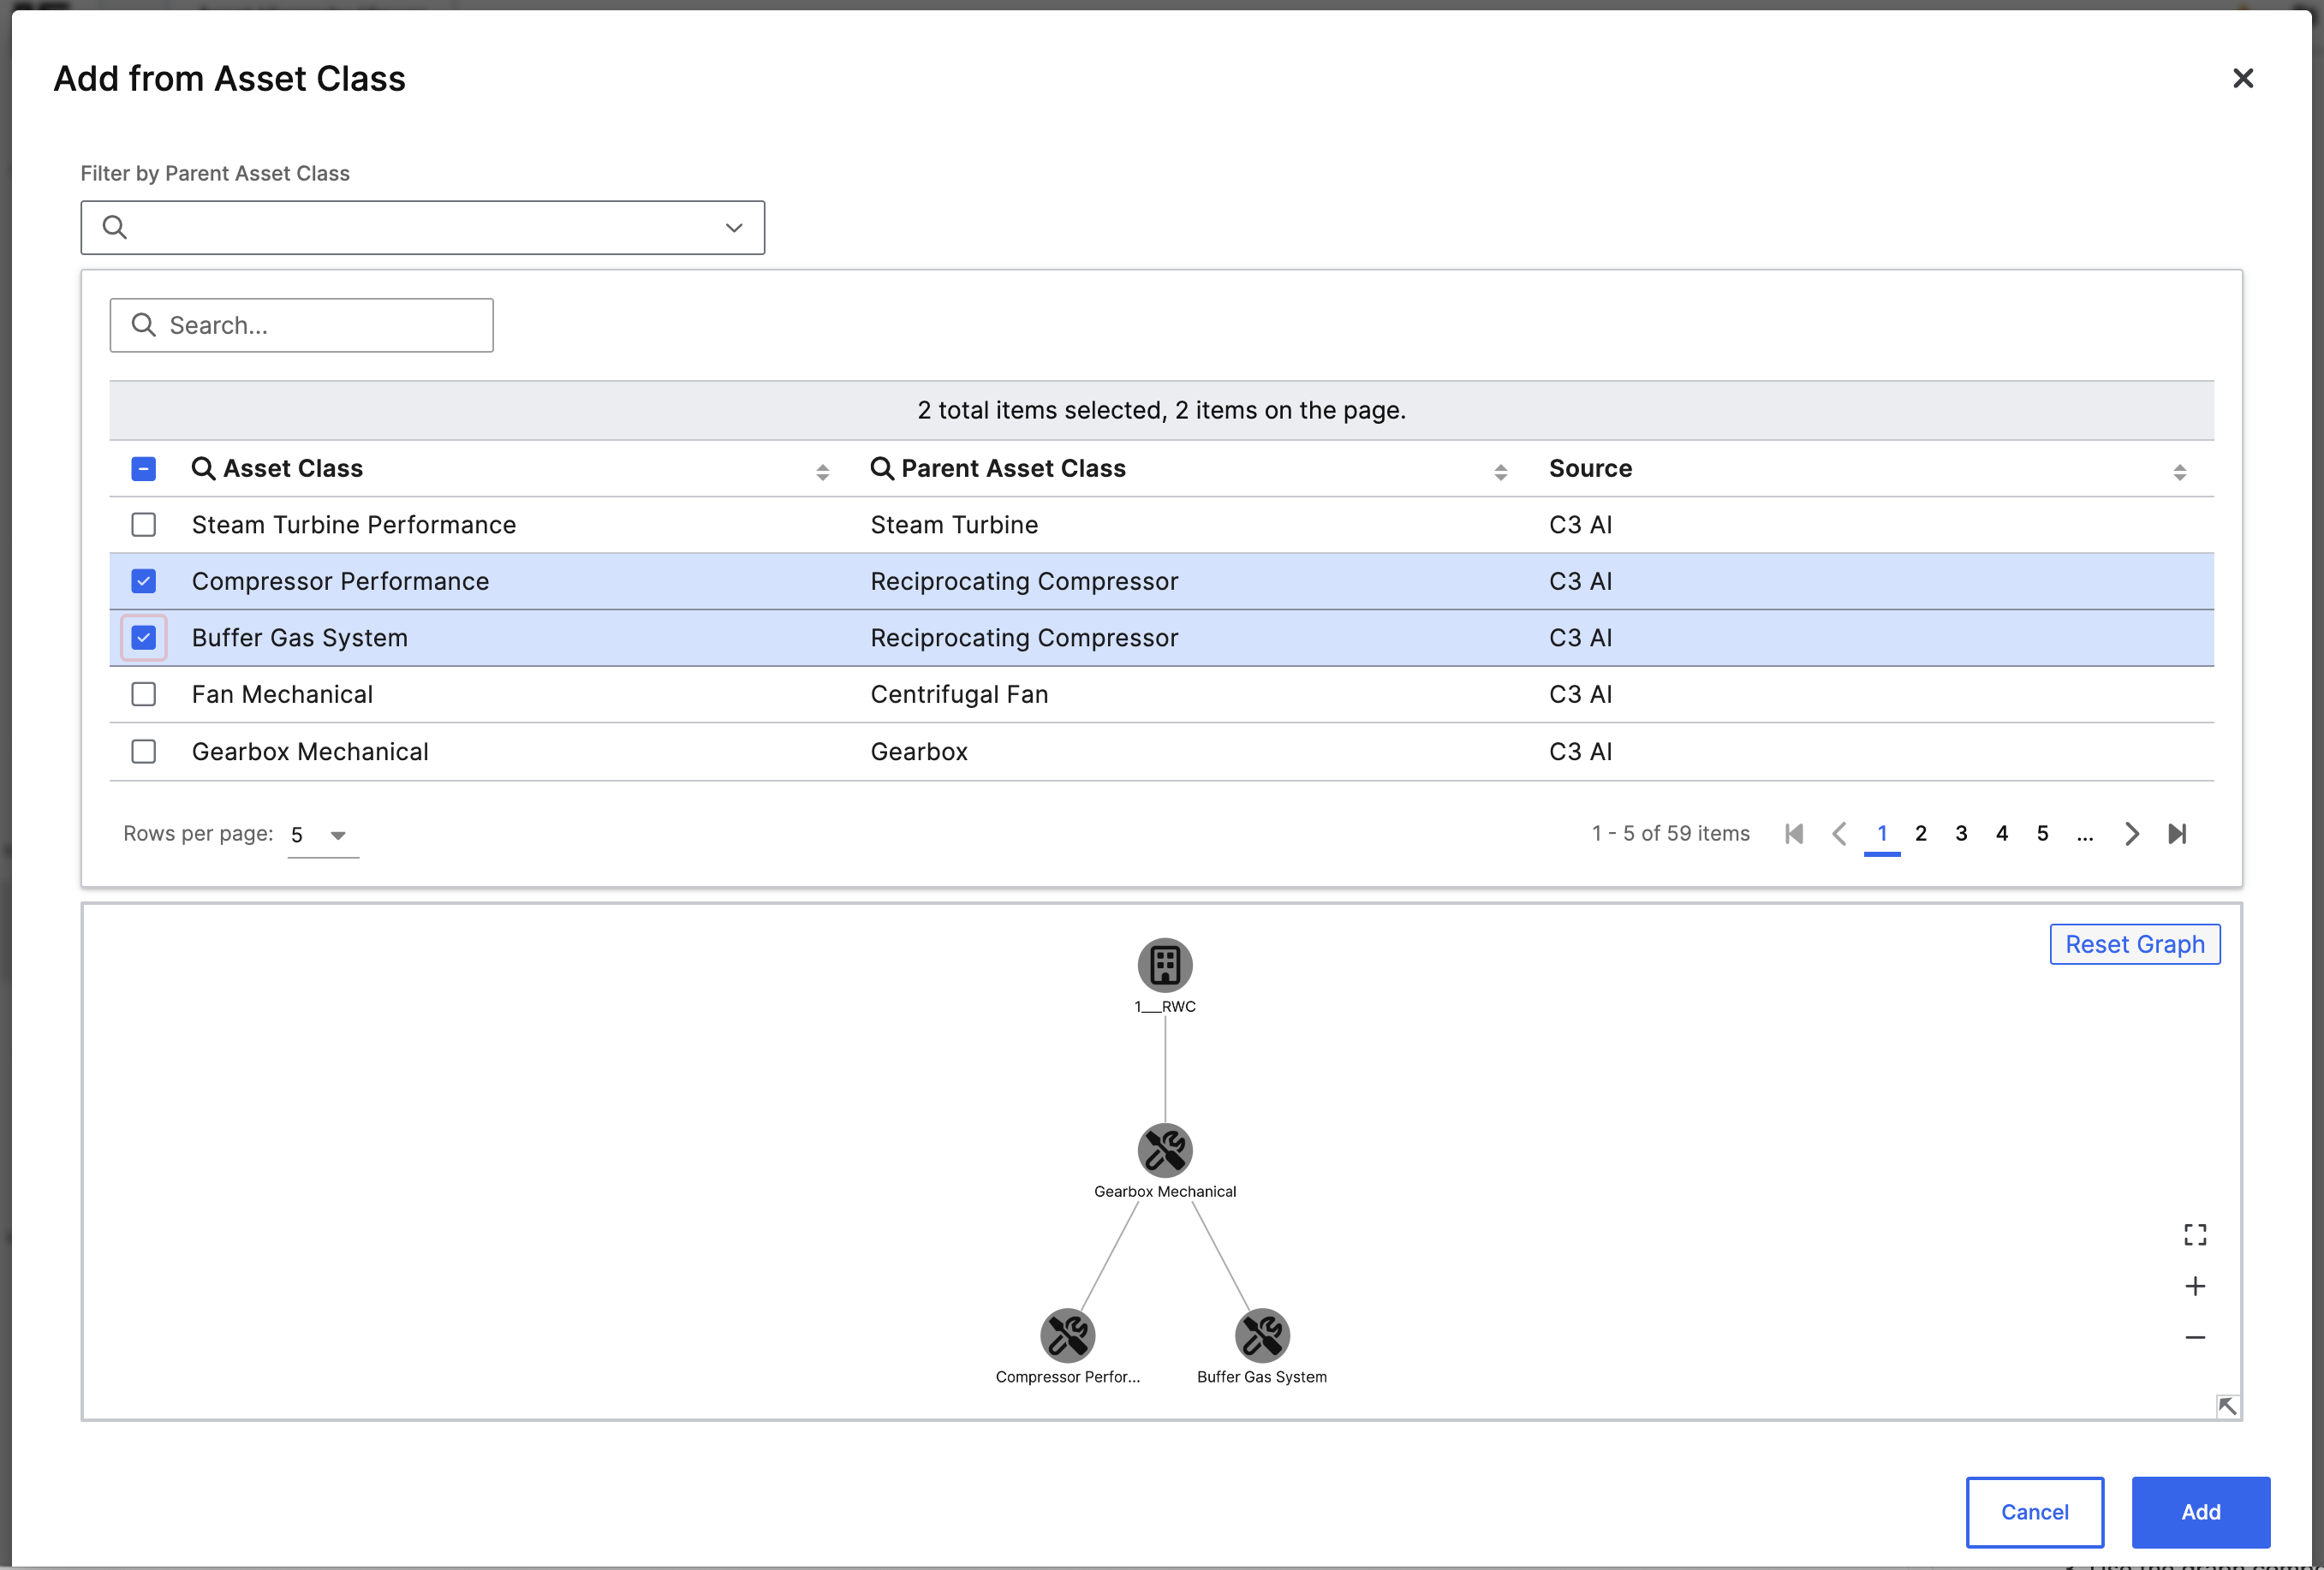
Add from asset class
Use asset classes to create a new asset with built-in expected sensors and failure modes.- Click
Add from Asset Class. - Filter by class if needed.
- Select one or more classes and click
Add.
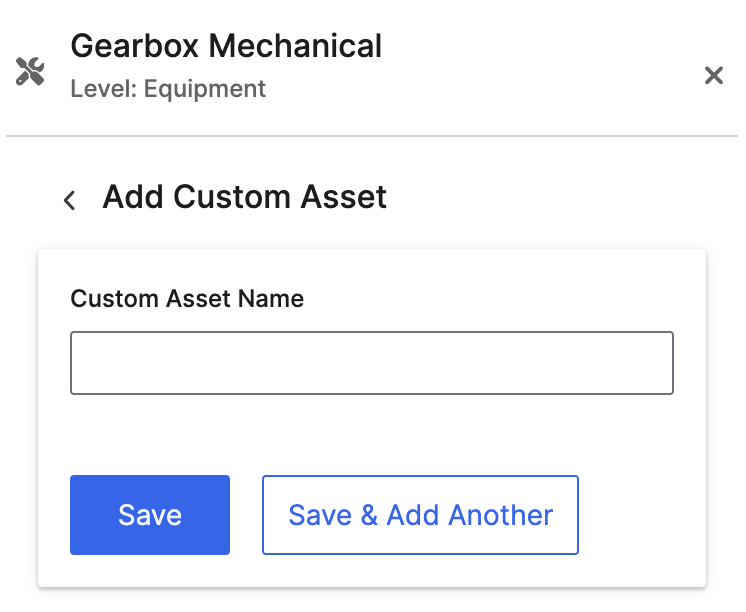
Add custom asset
To create an asset manually:- Click
Add Custom Asset. - Enter a name and click
Save.
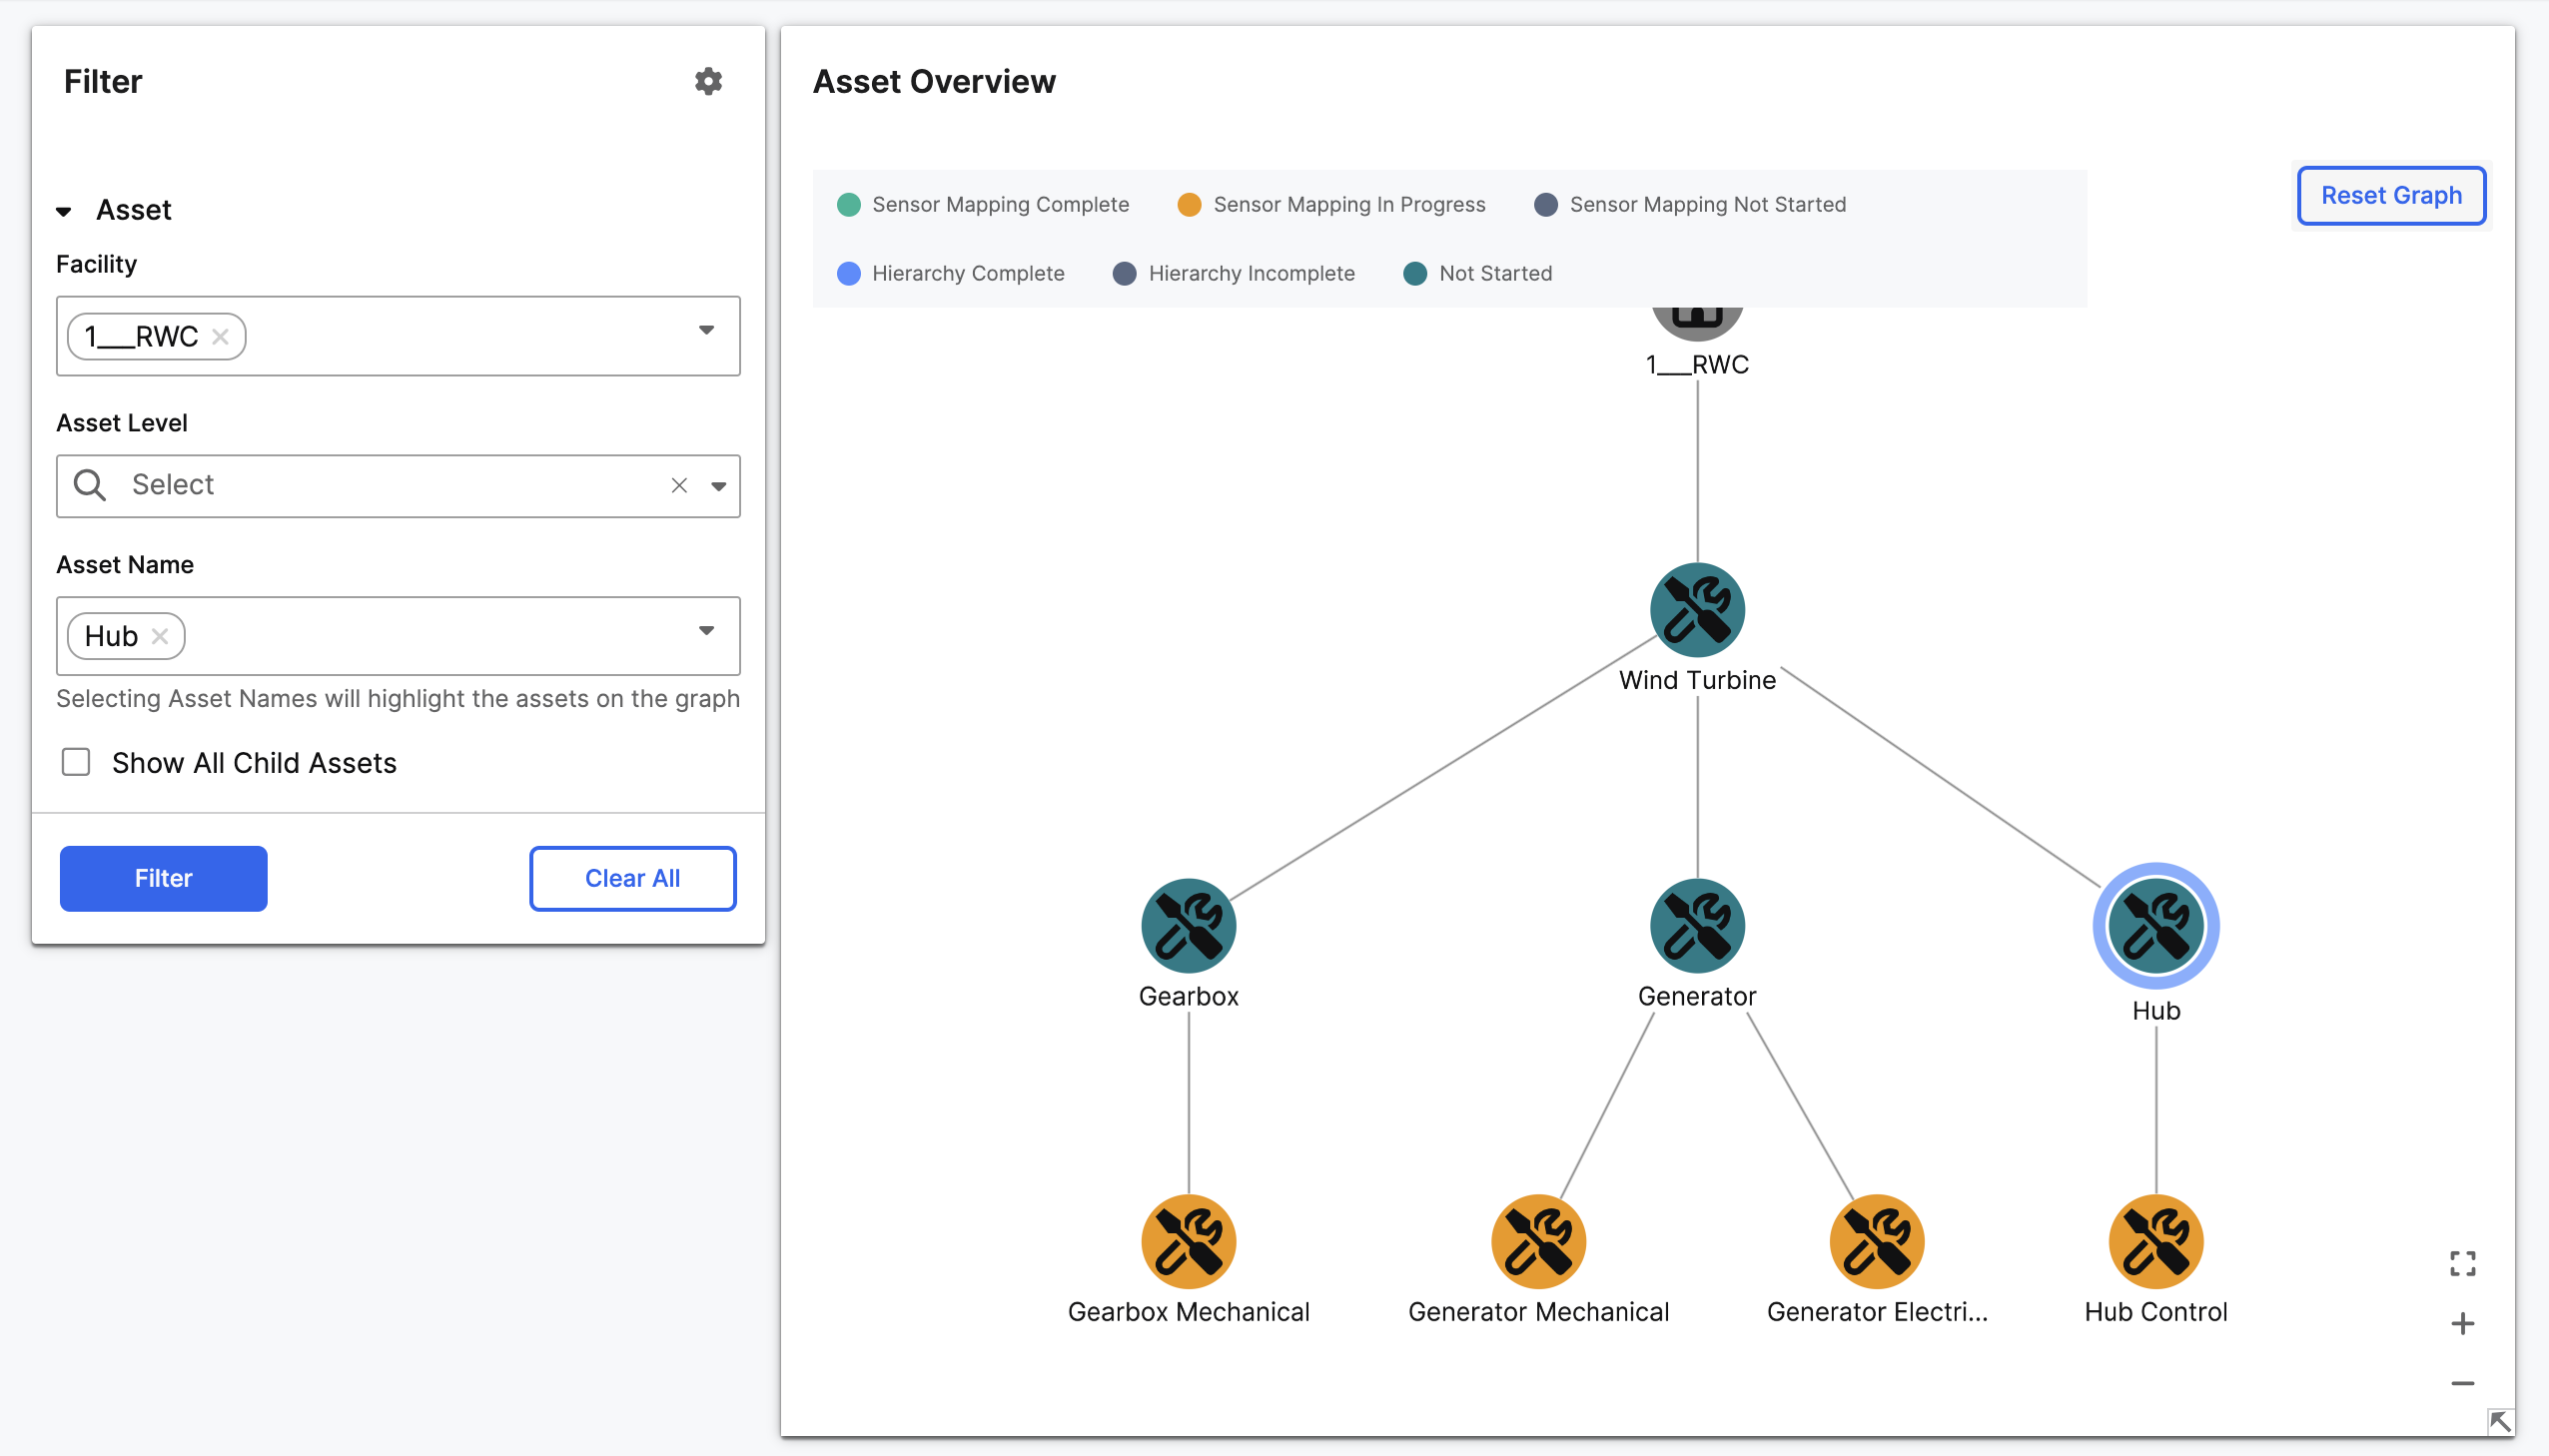
Step 3: manage the hierarchy
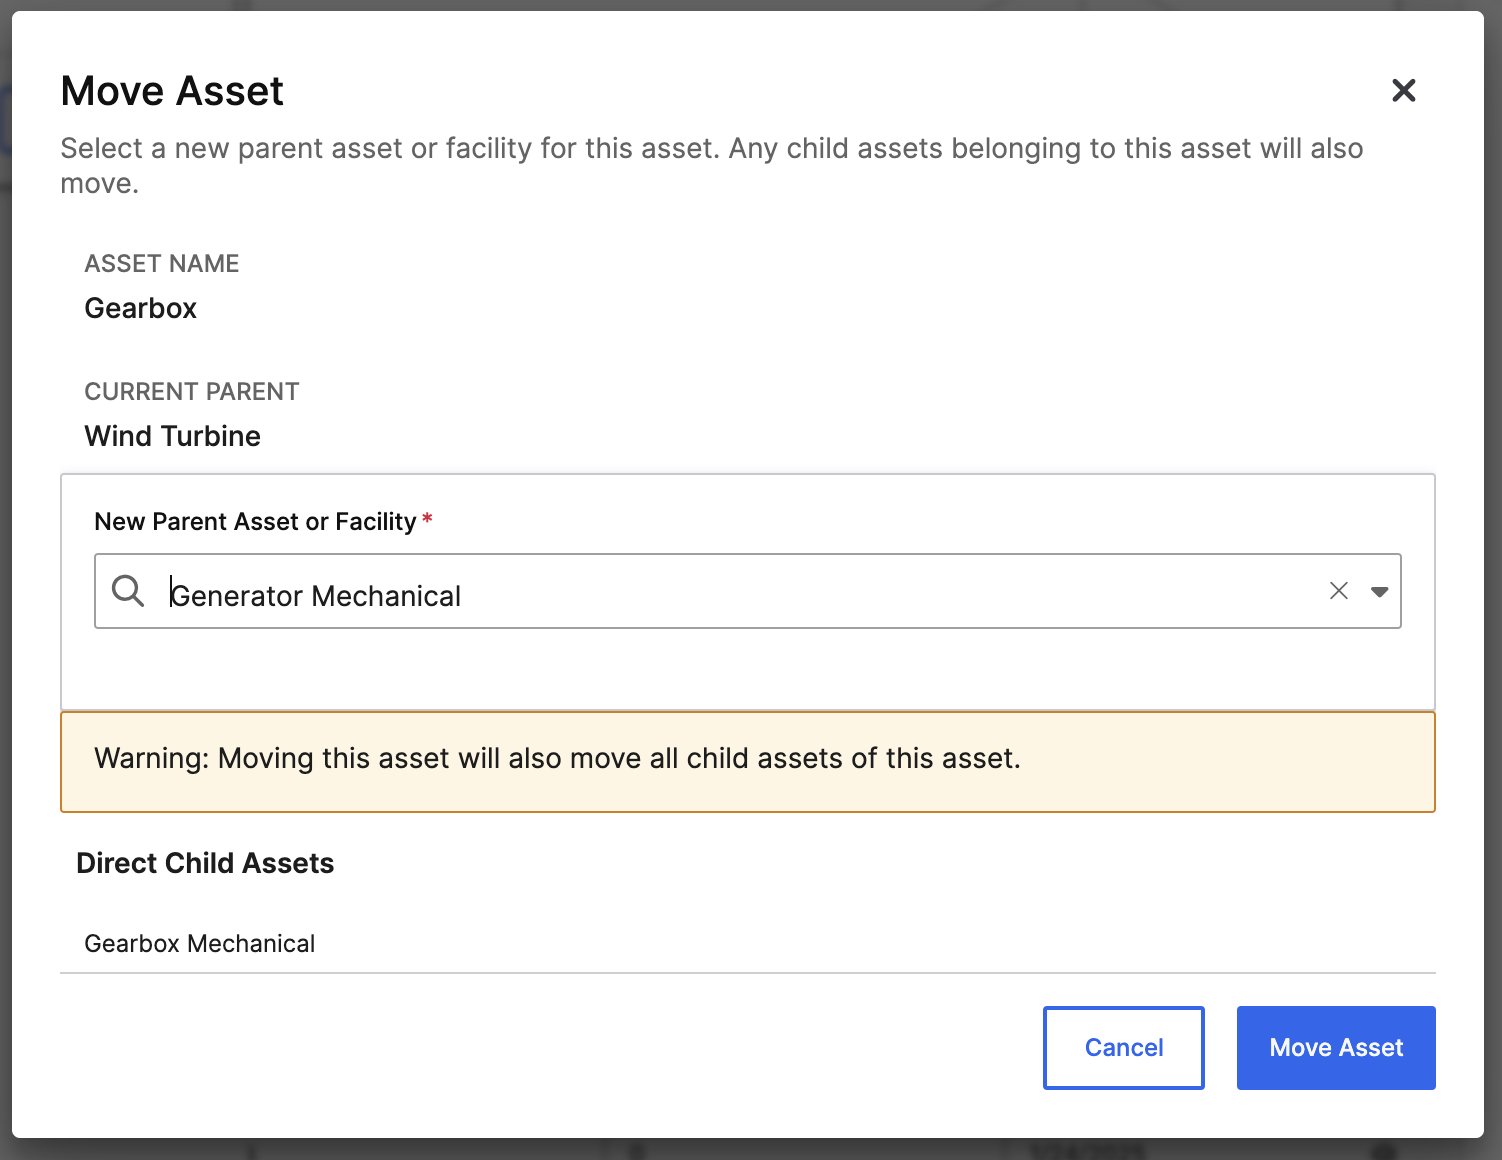
From either the graph or the table view, you can:- Move assets to reparent them
- Duplicate assets and their children
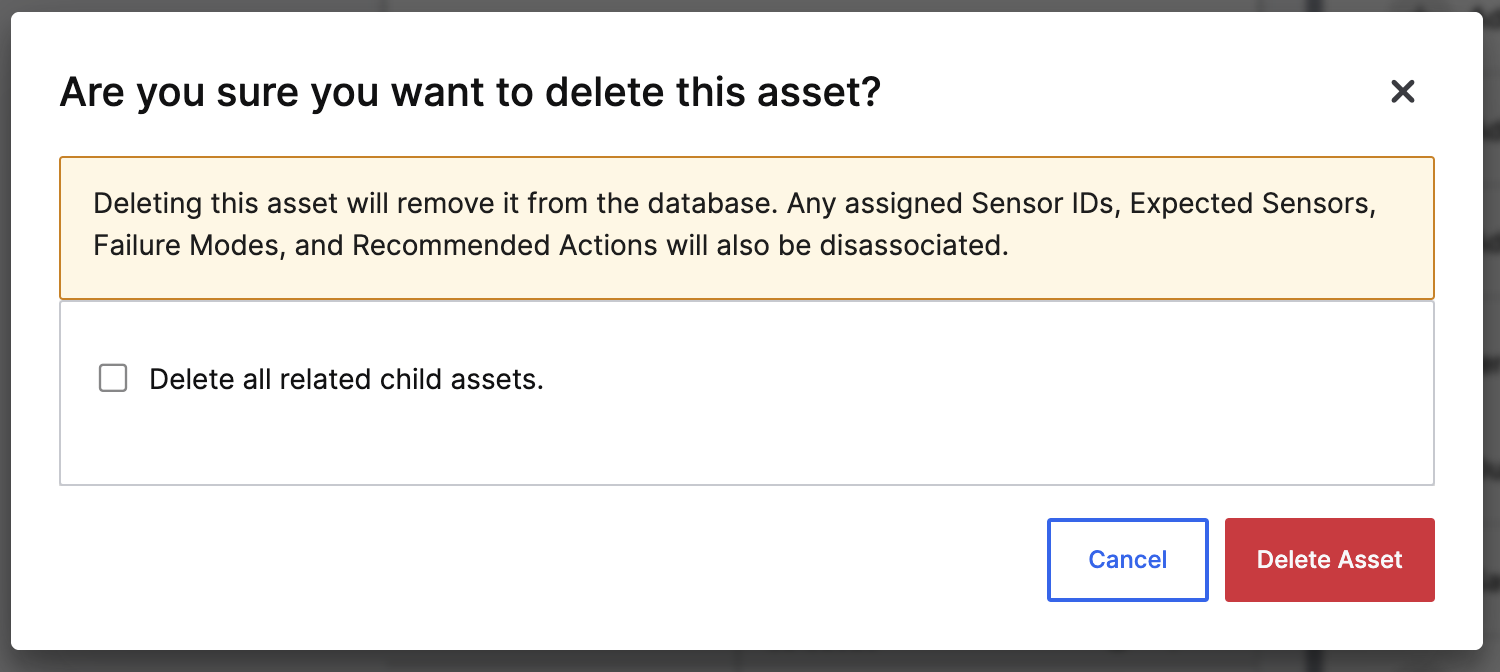
- Delete assets
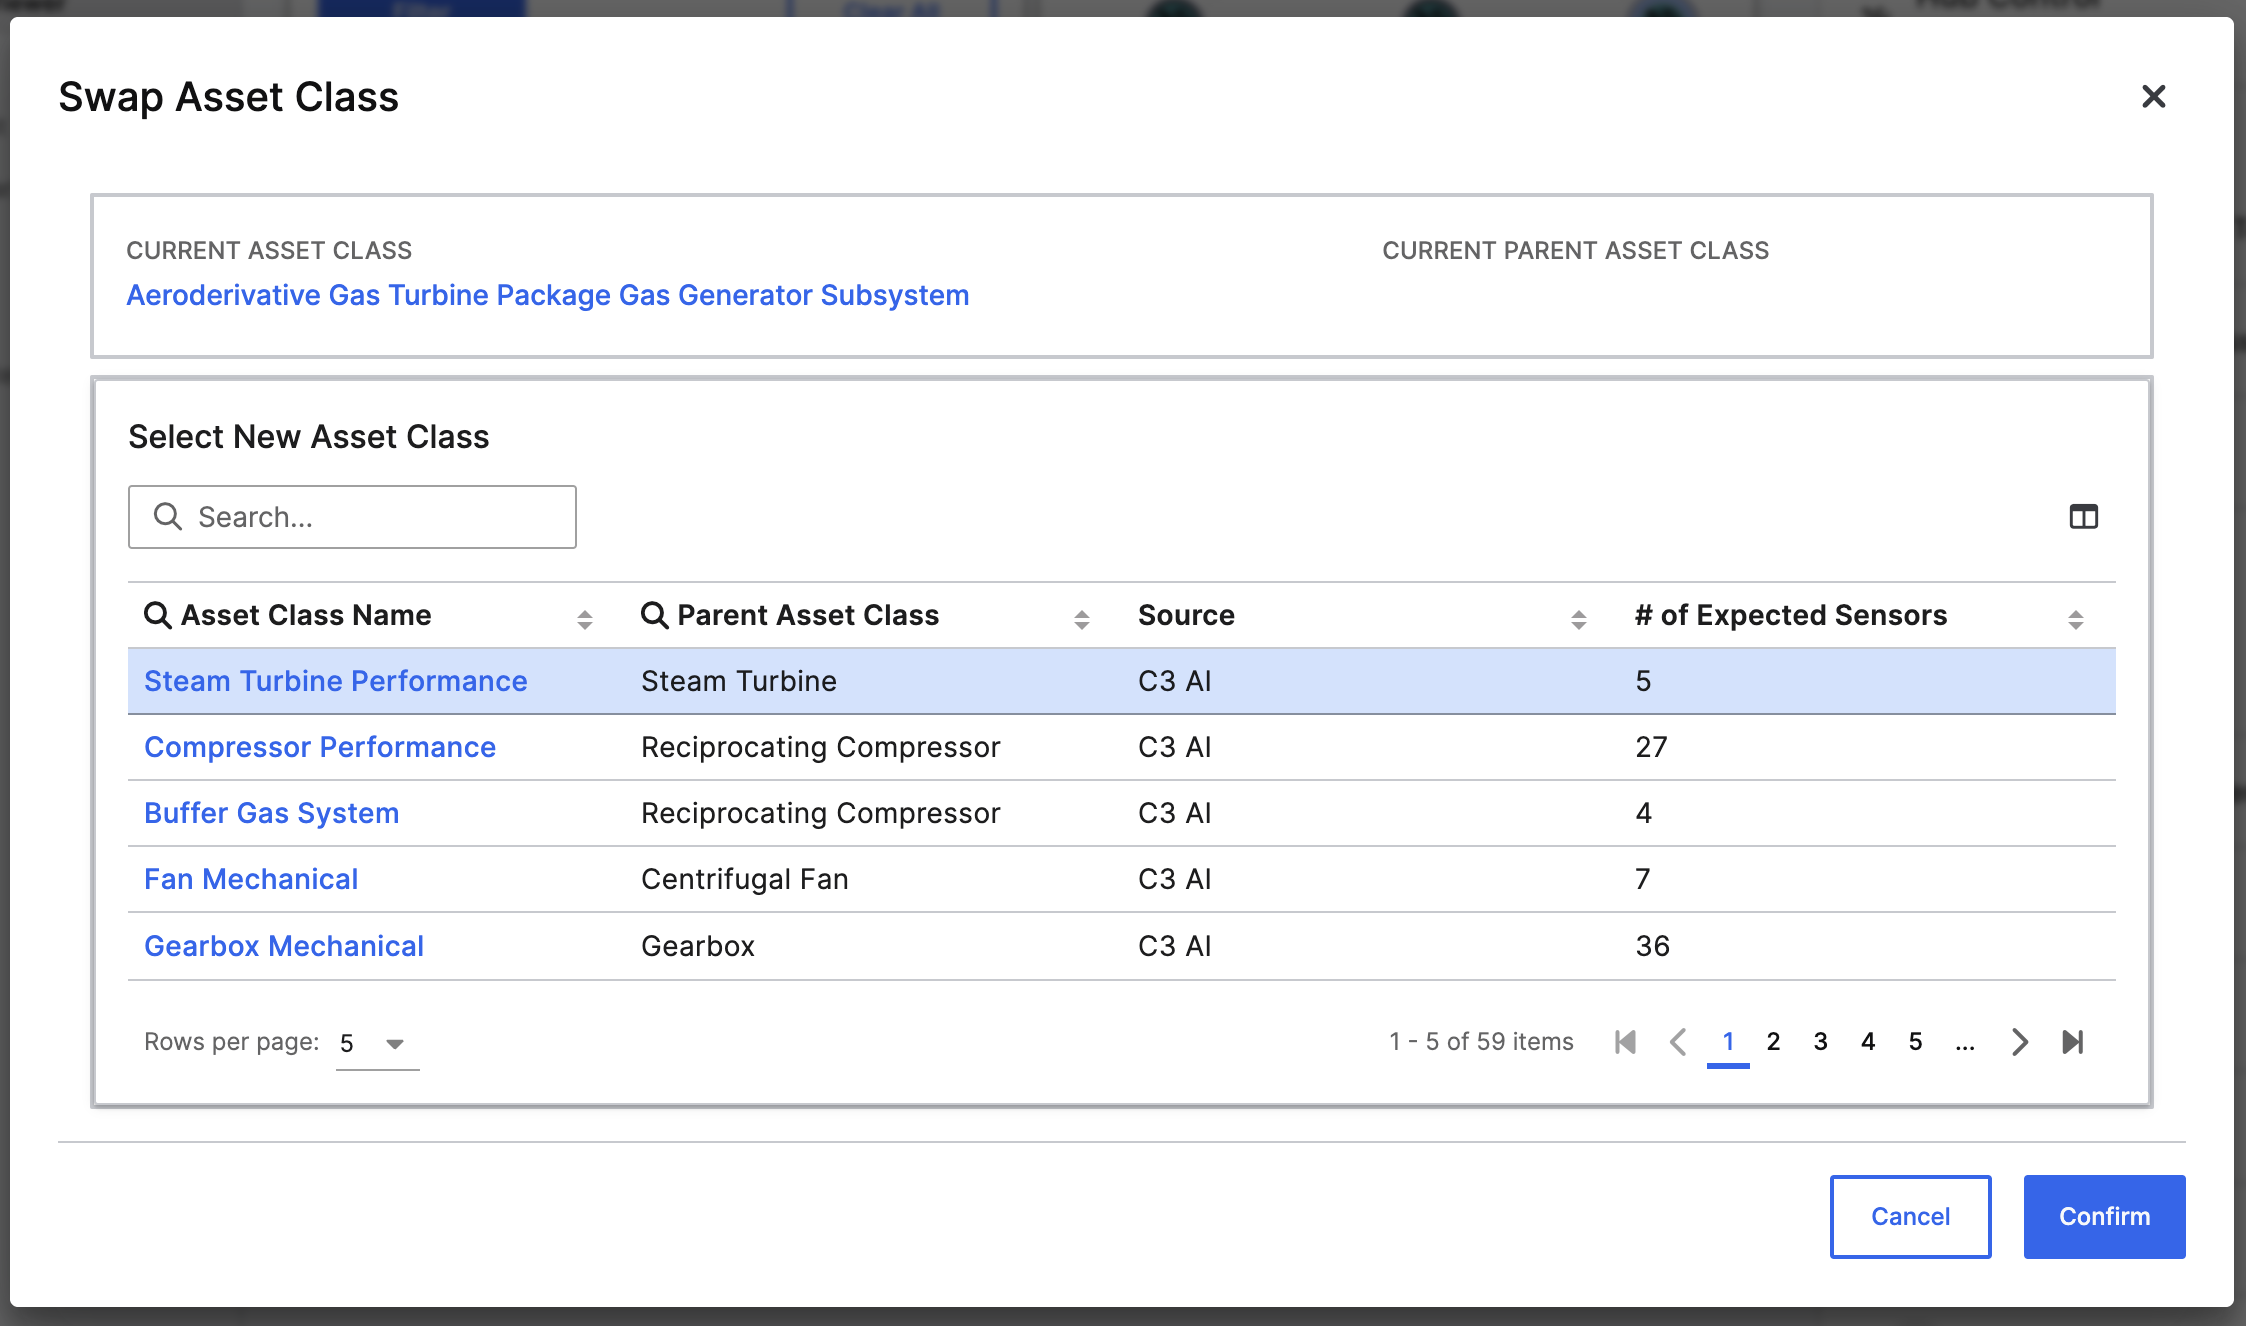
- Swap asset class to change which diagnostics and expected sensors apply
- Save as template to reuse structures later
Step 4: map sensors to assets
ClickMap Sensors on any asset to open the Sensor Mapping page.
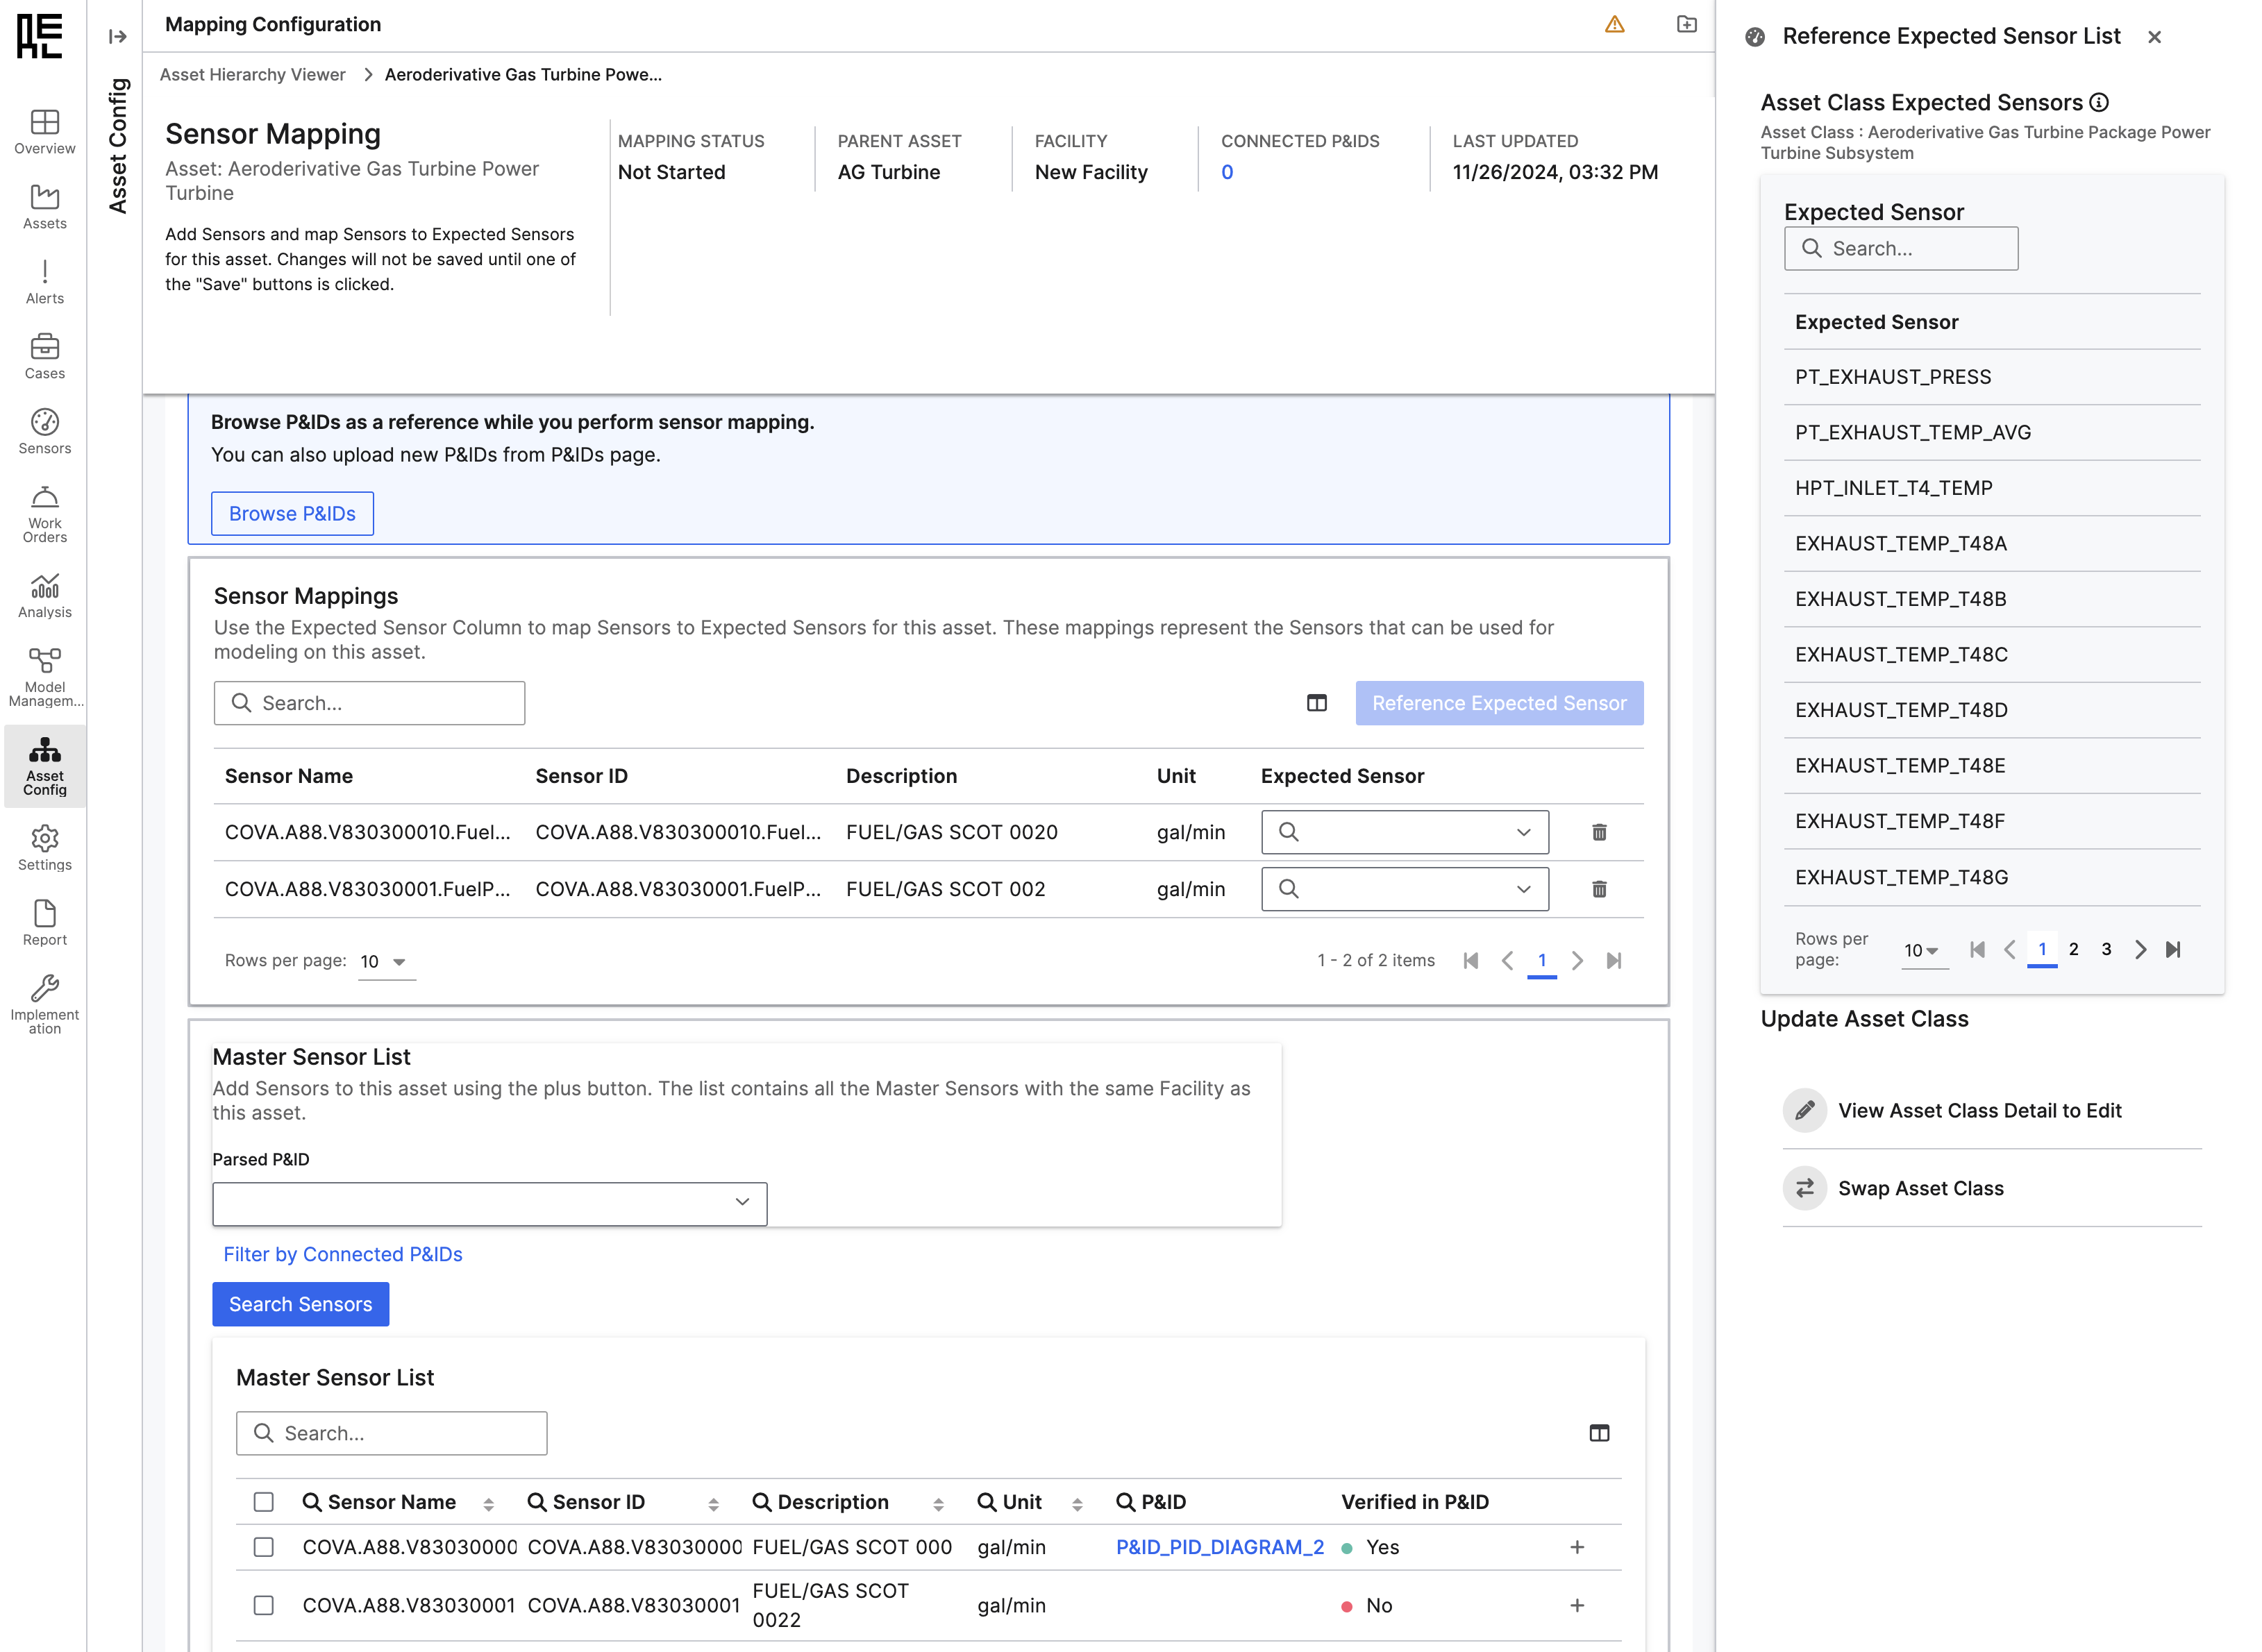 From here:
- Use the Master Sensor List to search for relevant telemetry
- Add sensors to the asset with the + button or multi-select checkboxes
- Reference
ExpectedSensorentries to understand what each asset class expects - Use the dropdown in the
Expected Sensorcolumn to formally map physical sensors to canonical sensor types
This mapping step enables model scoring, diagnostic reasoning, and alert triggering. Sensors that are not mapped to an expected sensor will not be included in model inputs or failure mode detection.You can save as draft if you’re still reviewing, or mark as complete once the mapping is finished.
Step 5: use P&ID parsing (optional)
If diagrams have been parsed and connected:- Use
Filter by Connected P&IDsto limit sensor selection to those confirmed in the diagram - Use
Browse P&IDsto view diagrams in a second tab for reference
Step 6: finalize and commit changes
Once your hierarchy is built and sensors are mapped:- Confirm all assets have assigned classes
- Ensure each mapped sensor is aligned with an expected sensor
- Click Save Changes to persist your updates